
 Yahoo Finance
 Overstock.com, Inc.'s (NASDAQ:OSTK) 28% Share Price Surge Not Quite Adding Up
Despite an already strong run, Overstock.com, Inc. (NASDAQ:OSTK) shares have been powering on, with a gain of 28% in the last thirty days. The last 30 days bring the annual gain to a very sharp 68%.
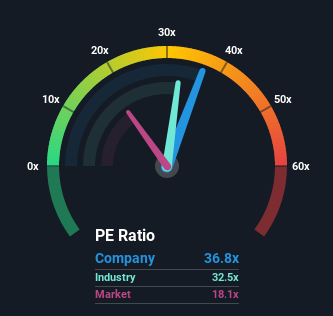
After such a large jump in price, Overstock.com may be sending very bearish signals at the moment with a price-to-earnings (or "P/E") ratio of 36.8x, since almost half of all companies in the United States have P/E ratios under 18x and even P/E's lower than 10x are not unusual. However, the P/E might be quite high for a reason and it requires further investigation to determine if it's justified.
Recent times have been advantageous for Overstock.com as its earnings have been rising faster than most other companies. It seems that many are expecting the strong earnings performance to persist, which has raised the P/E. If not, then existing shareholders might be a little nervous about the viability of the share price.
Check out our latest analysis for Overstock.com
Want the full picture on analyst estimates for the company? Then our free report on Overstock.com will help you uncover what's on the horizon.
How Is Overstock.com's Growth Trending?
There's an inherent assumption that a company should far outperform the market for P/E ratios like Overstock.com's to be considered reasonable.
If we review the last year of earnings growth, the company posted a terrific increase of 298%. Still, EPS has barely risen at all from three years ago in total, which is not ideal. So it appears to us that the company has had a mixed result in terms of growing earnings over that time.
Looking ahead now, EPS is anticipated to climb by 0.4% per year during the coming three years according to the seven analysts following the company. Meanwhile, the rest of the market is forecast to expand by 12% per year, which is noticeably more attractive.
In light of this, it's alarming that Overstock.com's P/E sits above the majority of other companies. Apparently many investors in the company are way more bullish than analysts indicate and aren't willing to let go of their stock at any price. Only the boldest would assume these prices are sustainable as this level of earnings growth is likely to weigh heavily on the share price eventually.
The Bottom Line On Overstock.com's P/E
Shares in Overstock.com have built up some good momentum lately, which has really inflated its P/E. Generally, our preference is to limit the use of the price-to-earnings ratio to establishing what the market thinks about the overall health of a company.
We've established that Overstock.com currently trades on a much higher than expected P/E since its forecast growth is lower than the wider market. Right now we are increasingly uncomfortable with the high P/E as the predicted future earnings aren't likely to support such positive sentiment for long. Unless these conditions improve markedly, it's very challenging to accept these prices as being reasonable.
Before you take the next step, you should know about the 3 warning signs for Overstock.com that we have uncovered.
You might be able to find a better investment than Overstock.com. If you want a selection of possible candidates, check out this free list of interesting companies that trade on a P/E below 20x (but have proven they can grow earnings).
This article by Simply Wall St is general in nature. We provide commentary based on historical data and analyst forecasts only using an unbiased methodology and our articles are not intended to be financial advice. It does not constitute a recommendation to buy or sell any stock, and does not take account of your objectives, or your financial situation. We aim to bring you long-term focused analysis driven by fundamental data. Note that our analysis may not factor in the latest price-sensitive company announcements or qualitative material. Simply Wall St has no position in any stocks mentioned.
Have feedback on this article? Concerned about the content? Get in touch with us directly. Alternatively, email editorial-team (at) simplywallst.com.
