
 Yahoo Finance
 Overstock.com (NASDAQ:OSTK) sheds 11% this week, as yearly returns fall more in line with earnings growth
The Overstock.com, Inc. (NASDAQ:OSTK) share price has had a bad week, falling 11%. But that does not change the realty that the stock's performance has been terrific, over five years. To be precise, the stock price is 447% higher than it was five years ago, a wonderful performance by any measure. So we don't think the recent decline in the share price means its story is a sad one. Of course what matters most is whether the business can improve itself sustainably, thus justifying a higher price.
In light of the stock dropping 11% in the past week, we want to investigate the longer term story, and see if fundamentals have been the driver of the company's positive five-year return.
See our latest analysis for Overstock.com
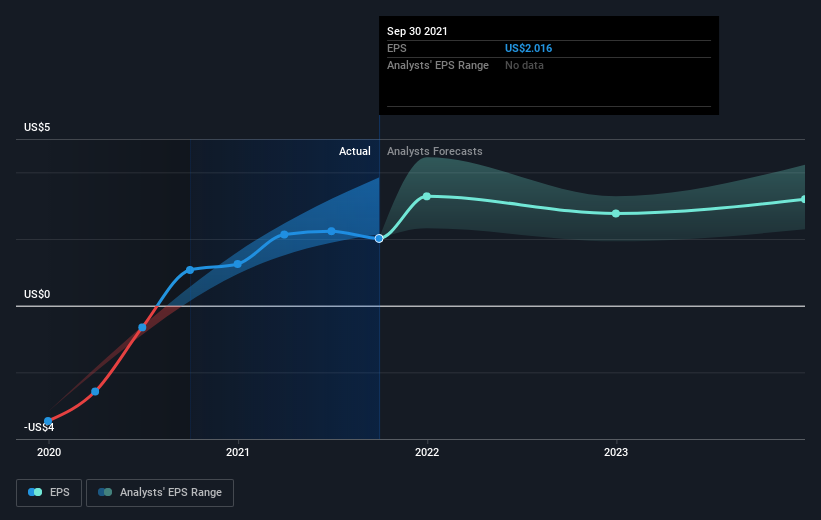
There is no denying that markets are sometimes efficient, but prices do not always reflect underlying business performance. By comparing earnings per share (EPS) and share price changes over time, we can get a feel for how investor attitudes to a company have morphed over time.
During the last half decade, Overstock.com became profitable. That kind of transition can be an inflection point that justifies a strong share price gain, just as we have seen here.
The graphic below depicts how EPS has changed over time (unveil the exact values by clicking on the image).
It's probably worth noting that the CEO is paid less than the median at similar sized companies. It's always worth keeping an eye on CEO pay, but a more important question is whether the company will grow earnings throughout the years. This free interactive report on Overstock.com's earnings, revenue and cash flow is a great place to start, if you want to investigate the stock further.
A Different Perspective
It's nice to see that Overstock.com shareholders have received a total shareholder return of 36% over the last year. Having said that, the five-year TSR of 40% a year, is even better. I find it very interesting to look at share price over the long term as a proxy for business performance. But to truly gain insight, we need to consider other information, too. Case in point: We've spotted 2 warning signs for Overstock.com you should be aware of.
For those who like to find winning investments this free list of growing companies with recent insider purchasing, could be just the ticket.
Please note, the market returns quoted in this article reflect the market weighted average returns of stocks that currently trade on US exchanges.
This article by Simply Wall St is general in nature. We provide commentary based on historical data and analyst forecasts only using an unbiased methodology and our articles are not intended to be financial advice. It does not constitute a recommendation to buy or sell any stock, and does not take account of your objectives, or your financial situation. We aim to bring you long-term focused analysis driven by fundamental data. Note that our analysis may not factor in the latest price-sensitive company announcements or qualitative material. Simply Wall St has no position in any stocks mentioned.
Have feedback on this article? Concerned about the content? Get in touch with us directly. Alternatively, email editorial-team (at) simplywallst.com.
