
 Yahoo Finance
 Is Oxford BioDynamics (LON:OBD) In A Good Position To Deliver On Growth Plans?
Even when a business is losing money, it's possible for shareholders to make money if they buy a good business at the right price. For example, although Amazon.com made losses for many years after listing, if you had bought and held the shares since 1999, you would have made a fortune. But the harsh reality is that very many loss making companies burn through all their cash and go bankrupt.
Given this risk, we thought we'd take a look at whether Oxford BioDynamics (LON:OBD) shareholders should be worried about its cash burn. For the purposes of this article, cash burn is the annual rate at which an unprofitable company spends cash to fund its growth; its negative free cash flow. The first step is to compare its cash burn with its cash reserves, to give us its 'cash runway'.
Check out our latest analysis for Oxford BioDynamics
Does Oxford BioDynamics Have A Long Cash Runway?
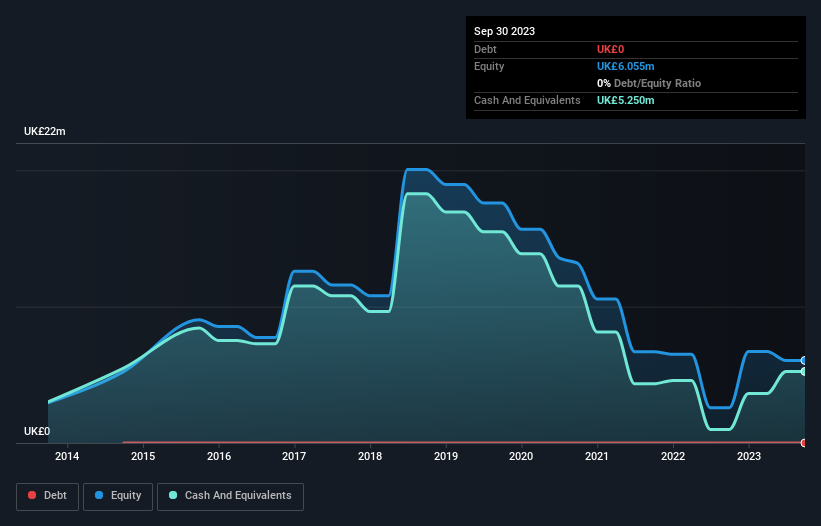
You can calculate a company's cash runway by dividing the amount of cash it has by the rate at which it is spending that cash. When Oxford BioDynamics last reported its balance sheet in September 2023, it had zero debt and cash worth UK£5.3m. Importantly, its cash burn was UK£9.0m over the trailing twelve months. That means it had a cash runway of around 7 months as of September 2023. To be frank, this kind of short runway puts us on edge, as it indicates the company must reduce its cash burn significantly, or else raise cash imminently. The image below shows how its cash balance has been changing over the last few years.
How Is Oxford BioDynamics' Cash Burn Changing Over Time?
Although Oxford BioDynamics had revenue of UK£510k in the last twelve months, its operating revenue was only UK£510k in that time period. Given how low that operating leverage is, we think it's too early to put much weight on the revenue growth, so we'll focus on how the cash burn is changing, instead. Over the last year its cash burn actually increased by 48%, which suggests that management are increasing investment in future growth, but not too quickly. However, the company's true cash runway will therefore be shorter than suggested above, if spending continues to increase. Admittedly, we're a bit cautious of Oxford BioDynamics due to its lack of significant operating revenues. So we'd generally prefer stocks from this list of stocks that have analysts forecasting growth.
How Hard Would It Be For Oxford BioDynamics To Raise More Cash For Growth?
Given its cash burn trajectory, Oxford BioDynamics shareholders should already be thinking about how easy it might be for it to raise further cash in the future. Issuing new shares, or taking on debt, are the most common ways for a listed company to raise more money for its business. One of the main advantages held by publicly listed companies is that they can sell shares to investors to raise cash and fund growth. By looking at a company's cash burn relative to its market capitalisation, we gain insight on how much shareholders would be diluted if the company needed to raise enough cash to cover another year's cash burn.
Oxford BioDynamics has a market capitalisation of UK£53m and burnt through UK£9.0m last year, which is 17% of the company's market value. As a result, we'd venture that the company could raise more cash for growth without much trouble, albeit at the cost of some dilution.
So, Should We Worry About Oxford BioDynamics' Cash Burn?
On this analysis of Oxford BioDynamics' cash burn, we think its cash burn relative to its market cap was reassuring, while its cash runway has us a bit worried. Considering all the measures mentioned in this report, we reckon that its cash burn is fairly risky, and if we held shares we'd be watching like a hawk for any deterioration. Separately, we looked at different risks affecting the company and spotted 7 warning signs for Oxford BioDynamics (of which 3 can't be ignored!) you should know about.
Of course, you might find a fantastic investment by looking elsewhere. So take a peek at this free list of companies insiders are buying, and this list of stocks growth stocks (according to analyst forecasts)
Have feedback on this article? Concerned about the content? Get in touch with us directly. Alternatively, email editorial-team (at) simplywallst.com.
This article by Simply Wall St is general in nature. We provide commentary based on historical data and analyst forecasts only using an unbiased methodology and our articles are not intended to be financial advice. It does not constitute a recommendation to buy or sell any stock, and does not take account of your objectives, or your financial situation. We aim to bring you long-term focused analysis driven by fundamental data. Note that our analysis may not factor in the latest price-sensitive company announcements or qualitative material. Simply Wall St has no position in any stocks mentioned.
