
 Yahoo Finance
 Oxford Instruments plc (LON:OXIG) Is Employing Capital Very Effectively

Today we are going to look at Oxford Instruments plc (LON:OXIG) to see whether it might be an attractive investment prospect. In particular, we'll consider its Return On Capital Employed (ROCE), as that can give us insight into how profitably the company is able to employ capital in its business.
First, we'll go over how we calculate ROCE. Second, we'll look at its ROCE compared to similar companies. Finally, we'll look at how its current liabilities affect its ROCE.
Understanding Return On Capital Employed (ROCE)
ROCE is a measure of a company's yearly pre-tax profit (its return), relative to the capital employed in the business. Generally speaking a higher ROCE is better. Ultimately, it is a useful but imperfect metric. Author Edwin Whiting says to be careful when comparing the ROCE of different businesses, since 'No two businesses are exactly alike.
How Do You Calculate Return On Capital Employed?
The formula for calculating the return on capital employed is:
Return on Capital Employed = Earnings Before Interest and Tax (EBIT) ÷ (Total Assets - Current Liabilities)
Or for Oxford Instruments:
0.18 = UK£46m ÷ (UK£392m - UK£135m) (Based on the trailing twelve months to September 2019.)
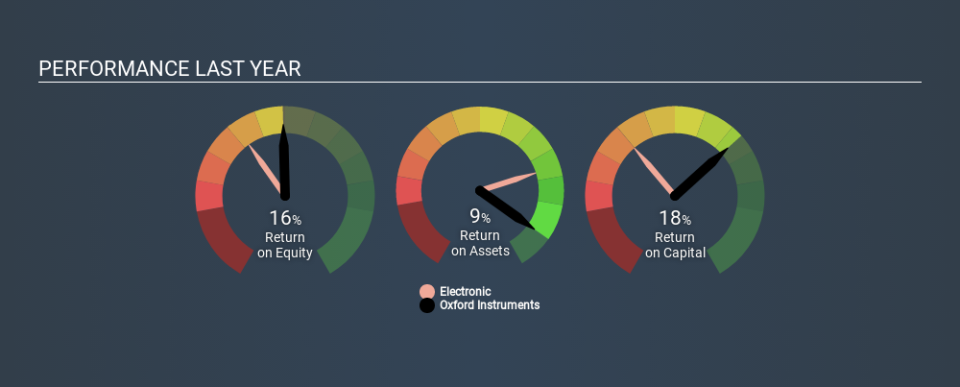
Therefore, Oxford Instruments has an ROCE of 18%.
View our latest analysis for Oxford Instruments
Does Oxford Instruments Have A Good ROCE?
ROCE can be useful when making comparisons, such as between similar companies. In our analysis, Oxford Instruments's ROCE is meaningfully higher than the 9.5% average in the Electronic industry. We would consider this a positive, as it suggests it is using capital more effectively than other similar companies. Separate from Oxford Instruments's performance relative to its industry, its ROCE in absolute terms looks satisfactory, and it may be worth researching in more depth.
Our data shows that Oxford Instruments currently has an ROCE of 18%, compared to its ROCE of 7.2% 3 years ago. This makes us think the business might be improving. The image below shows how Oxford Instruments's ROCE compares to its industry, and you can click it to see more detail on its past growth.
When considering ROCE, bear in mind that it reflects the past and does not necessarily predict the future. ROCE can be misleading for companies in cyclical industries, with returns looking impressive during the boom times, but very weak during the busts. ROCE is, after all, simply a snap shot of a single year. Future performance is what matters, and you can see analyst predictions in our free report on analyst forecasts for the company.
Oxford Instruments's Current Liabilities And Their Impact On Its ROCE
Current liabilities include invoices, such as supplier payments, short-term debt, or a tax bill, that need to be paid within 12 months. Due to the way ROCE is calculated, a high level of current liabilities makes a company look as though it has less capital employed, and thus can (sometimes unfairly) boost the ROCE. To check the impact of this, we calculate if a company has high current liabilities relative to its total assets.
Oxford Instruments has total assets of UK£392m and current liabilities of UK£135m. As a result, its current liabilities are equal to approximately 34% of its total assets. Oxford Instruments has a middling amount of current liabilities, increasing its ROCE somewhat.
What We Can Learn From Oxford Instruments's ROCE
Oxford Instruments's ROCE does look good, but the level of current liabilities also contribute to that. There might be better investments than Oxford Instruments out there, but you will have to work hard to find them . These promising businesses with rapidly growing earnings might be right up your alley.
I will like Oxford Instruments better if I see some big insider buys. While we wait, check out this free list of growing companies with considerable, recent, insider buying.
If you spot an error that warrants correction, please contact the editor at editorial-team@simplywallst.com. This article by Simply Wall St is general in nature. It does not constitute a recommendation to buy or sell any stock, and does not take account of your objectives, or your financial situation. Simply Wall St has no position in the stocks mentioned.
We aim to bring you long-term focused research analysis driven by fundamental data. Note that our analysis may not factor in the latest price-sensitive company announcements or qualitative material. Thank you for reading.
