
 Yahoo Finance
 Oxford Metrics (LON:OMG) Is Reinvesting At Lower Rates Of Return
If we want to find a potential multi-bagger, often there are underlying trends that can provide clues. Amongst other things, we'll want to see two things; firstly, a growing return on capital employed (ROCE) and secondly, an expansion in the company's amount of capital employed. Put simply, these types of businesses are compounding machines, meaning they are continually reinvesting their earnings at ever-higher rates of return. In light of that, when we looked at Oxford Metrics (LON:OMG) and its ROCE trend, we weren't exactly thrilled.
Understanding Return On Capital Employed (ROCE)
Just to clarify if you're unsure, ROCE is a metric for evaluating how much pre-tax income (in percentage terms) a company earns on the capital invested in its business. To calculate this metric for Oxford Metrics, this is the formula:
Return on Capital Employed = Earnings Before Interest and Tax (EBIT) ÷ (Total Assets - Current Liabilities)
0.03 = UK£2.5m ÷ (UK£95m - UK£12m) (Based on the trailing twelve months to September 2022).
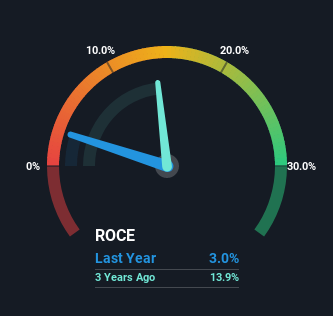
Therefore, Oxford Metrics has an ROCE of 3.0%. Ultimately, that's a low return and it under-performs the Software industry average of 9.0%.
View our latest analysis for Oxford Metrics
In the above chart we have measured Oxford Metrics' prior ROCE against its prior performance, but the future is arguably more important. If you'd like to see what analysts are forecasting going forward, you should check out our free report for Oxford Metrics.
What The Trend Of ROCE Can Tell Us
When we looked at the ROCE trend at Oxford Metrics, we didn't gain much confidence. Around five years ago the returns on capital were 13%, but since then they've fallen to 3.0%. Meanwhile, the business is utilizing more capital but this hasn't moved the needle much in terms of sales in the past 12 months, so this could reflect longer term investments. It's worth keeping an eye on the company's earnings from here on to see if these investments do end up contributing to the bottom line.
On a related note, Oxford Metrics has decreased its current liabilities to 12% of total assets. So we could link some of this to the decrease in ROCE. What's more, this can reduce some aspects of risk to the business because now the company's suppliers or short-term creditors are funding less of its operations. Some would claim this reduces the business' efficiency at generating ROCE since it is now funding more of the operations with its own money.
In Conclusion...
In summary, Oxford Metrics is reinvesting funds back into the business for growth but unfortunately it looks like sales haven't increased much just yet. Since the stock has gained an impressive 77% over the last five years, investors must think there's better things to come. But if the trajectory of these underlying trends continue, we think the likelihood of it being a multi-bagger from here isn't high.
One more thing: We've identified 5 warning signs with Oxford Metrics (at least 3 which can't be ignored) , and understanding them would certainly be useful.
While Oxford Metrics may not currently earn the highest returns, we've compiled a list of companies that currently earn more than 25% return on equity. Check out this free list here.
Have feedback on this article? Concerned about the content? Get in touch with us directly. Alternatively, email editorial-team (at) simplywallst.com.
This article by Simply Wall St is general in nature. We provide commentary based on historical data and analyst forecasts only using an unbiased methodology and our articles are not intended to be financial advice. It does not constitute a recommendation to buy or sell any stock, and does not take account of your objectives, or your financial situation. We aim to bring you long-term focused analysis driven by fundamental data. Note that our analysis may not factor in the latest price-sensitive company announcements or qualitative material. Simply Wall St has no position in any stocks mentioned.
Join A Paid User Research Session
You’ll receive a US$30 Amazon Gift card for 1 hour of your time while helping us build better investing tools for the individual investors like yourself. Sign up here
