
 Yahoo Finance
 Oxford Metrics plc's (LON:OMG) Stock's Been Going Strong: Could Weak Financials Mean The Market Will Correct Its Share Price?
Oxford Metrics (LON:OMG) has had a great run on the share market with its stock up by a significant 21% over the last three months. However, in this article, we decided to focus on its weak fundamentals, as long-term financial performance of a business is what ultimately dictates market outcomes. Particularly, we will be paying attention to Oxford Metrics' ROE today.
ROE or return on equity is a useful tool to assess how effectively a company can generate returns on the investment it received from its shareholders. In other words, it is a profitability ratio which measures the rate of return on the capital provided by the company's shareholders.
View our latest analysis for Oxford Metrics
How To Calculate Return On Equity?
The formula for return on equity is:
Return on Equity = Net Profit (from continuing operations) ÷ Shareholders' Equity
So, based on the above formula, the ROE for Oxford Metrics is:
4.3% = UK£3.4m ÷ UK£78m (Based on the trailing twelve months to September 2022).
The 'return' is the income the business earned over the last year. One way to conceptualize this is that for each £1 of shareholders' capital it has, the company made £0.04 in profit.
What Is The Relationship Between ROE And Earnings Growth?
Thus far, we have learned that ROE measures how efficiently a company is generating its profits. Based on how much of its profits the company chooses to reinvest or "retain", we are then able to evaluate a company's future ability to generate profits. Assuming everything else remains unchanged, the higher the ROE and profit retention, the higher the growth rate of a company compared to companies that don't necessarily bear these characteristics.
Oxford Metrics' Earnings Growth And 4.3% ROE
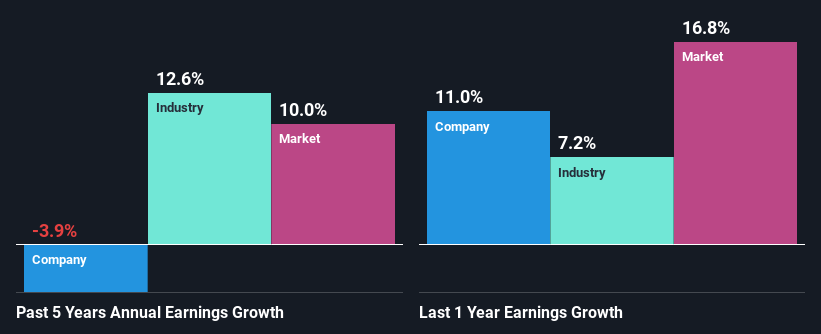
On the face of it, Oxford Metrics' ROE is not much to talk about. A quick further study shows that the company's ROE doesn't compare favorably to the industry average of 8.8% either. Therefore, it might not be wrong to say that the five year net income decline of 3.9% seen by Oxford Metrics was probably the result of it having a lower ROE. We believe that there also might be other aspects that are negatively influencing the company's earnings prospects. For instance, the company has a very high payout ratio, or is faced with competitive pressures.
So, as a next step, we compared Oxford Metrics' performance against the industry and were disappointed to discover that while the company has been shrinking its earnings, the industry has been growing its earnings at a rate of 13% in the same period.
Earnings growth is an important metric to consider when valuing a stock. What investors need to determine next is if the expected earnings growth, or the lack of it, is already built into the share price. Doing so will help them establish if the stock's future looks promising or ominous. One good indicator of expected earnings growth is the P/E ratio which determines the price the market is willing to pay for a stock based on its earnings prospects. So, you may want to check if Oxford Metrics is trading on a high P/E or a low P/E, relative to its industry.
Is Oxford Metrics Making Efficient Use Of Its Profits?
With a high three-year median payout ratio of 83% (implying that 17% of the profits are retained), most of Oxford Metrics' profits are being paid to shareholders, which explains the company's shrinking earnings. The business is only left with a small pool of capital to reinvest - A vicious cycle that doesn't benefit the company in the long-run. Our risks dashboard should have the 5 risks we have identified for Oxford Metrics.
Moreover, Oxford Metrics has been paying dividends for at least ten years or more suggesting that management must have perceived that the shareholders prefer dividends over earnings growth. Upon studying the latest analysts' consensus data, we found that the company's future payout ratio is expected to drop to 54% over the next three years. Accordingly, the expected drop in the payout ratio explains the expected increase in the company's ROE to 7.6%, over the same period.
Summary
Overall, we would be extremely cautious before making any decision on Oxford Metrics. The company has seen a lack of earnings growth as a result of retaining very little profits and whatever little it does retain, is being reinvested at a very low rate of return. So far, we've only made a quick discussion around the company's earnings growth. So it may be worth checking this free detailed graph of Oxford Metrics' past earnings, as well as revenue and cash flows to get a deeper insight into the company's performance.
Have feedback on this article? Concerned about the content? Get in touch with us directly. Alternatively, email editorial-team (at) simplywallst.com.
This article by Simply Wall St is general in nature. We provide commentary based on historical data and analyst forecasts only using an unbiased methodology and our articles are not intended to be financial advice. It does not constitute a recommendation to buy or sell any stock, and does not take account of your objectives, or your financial situation. We aim to bring you long-term focused analysis driven by fundamental data. Note that our analysis may not factor in the latest price-sensitive company announcements or qualitative material. Simply Wall St has no position in any stocks mentioned.
Join A Paid User Research Session
You’ll receive a US$30 Amazon Gift card for 1 hour of your time while helping us build better investing tools for the individual investors like yourself. Sign up here
