
 Yahoo Finance
 Here’s How P/E Ratios Can Help Us Understand Shurgard Self Storage SA (EBR:SHUR)

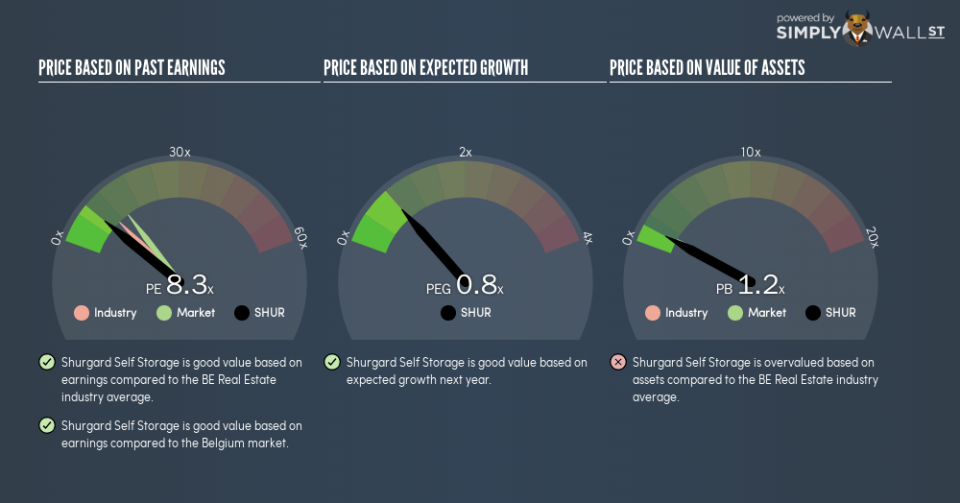
The goal of this article is to teach you how to use price to earnings ratios (P/E ratios). We’ll look at Shurgard Self Storage SA’s (EBR:SHUR) P/E ratio and reflect on what it tells us about the company’s share price. Based on the last twelve months, Shurgard Self Storage’s P/E ratio is 8.31. That means that at current prices, buyers pay €8.31 for every €1 in trailing yearly profits.
See our latest analysis for Shurgard Self Storage
Want to help shape the future of investing tools and platforms? Take the survey and be part of one of the most advanced studies of stock market investors to date.
How Do I Calculate A Price To Earnings Ratio?
The formula for P/E is:
Price to Earnings Ratio = Price per Share ÷ Earnings per Share (EPS)
Or for Shurgard Self Storage:
P/E of 8.31 = €25.6 ÷ €3.08 (Based on the year to June 2018.)
Is A High Price-to-Earnings Ratio Good?
A higher P/E ratio implies that investors pay a higher price for the earning power of the business. That is not a good or a bad thing per se, but a high P/E does imply buyers are optimistic about the future.
How Growth Rates Impact P/E Ratios
Earnings growth rates have a big influence on P/E ratios. That’s because companies that grow earnings per share quickly will rapidly increase the ‘E’ in the equation. That means even if the current P/E is high, it will reduce over time if the share price stays flat. A lower P/E should indicate the stock is cheap relative to others — and that may attract buyers.
Shurgard Self Storage’s earnings per share fell by 6.8% in the last twelve months.
How Does Shurgard Self Storage’s P/E Ratio Compare To Its Peers?
The P/E ratio essentially measures market expectations of a company. We can see in the image below that the average P/E (10.7) for companies in the real estate industry is higher than Shurgard Self Storage’s P/E.
Shurgard Self Storage’s P/E tells us that market participants think it will not fare as well as its peers in the same industry. Many investors like to buy stocks when the market is pessimistic about their prospects. It is arguably worth checking if insiders are buying shares, because that might imply they believe the stock is undervalued.
Don’t Forget: The P/E Does Not Account For Debt or Bank Deposits
Don’t forget that the P/E ratio considers market capitalization. In other words, it does not consider any debt or cash that the company may have on the balance sheet. In theory, a company can lower its future P/E ratio by using cash or debt to invest in growth.
Such spending might be good or bad, overall, but the key point here is that you need to look at debt to understand the P/E ratio in context.
Shurgard Self Storage’s Balance Sheet
Net debt totals 26% of Shurgard Self Storage’s market cap. This is a reasonably significant level of debt — all else being equal you’d expect a much lower P/E than if it had net cash.
The Bottom Line On Shurgard Self Storage’s P/E Ratio
Shurgard Self Storage’s P/E is 8.3 which is below average (14) in the BE market. Since it only carries a modest debt load, it’s likely the low expectations implied by the P/E ratio arise from the lack of recent earnings growth.
When the market is wrong about a stock, it gives savvy investors an opportunity. If the reality for a company is not as bad as the P/E ratio indicates, then the share price should increase as the market realizes this. So this free visual report on analyst forecasts could hold they key to an excellent investment decision.
Of course, you might find a fantastic investment by looking at a few good candidates. So take a peek at this free list of companies with modest (or no) debt, trading on a P/E below 20.
To help readers see past the short term volatility of the financial market, we aim to bring you a long-term focused research analysis purely driven by fundamental data. Note that our analysis does not factor in the latest price-sensitive company announcements.
The author is an independent contributor and at the time of publication had no position in the stocks mentioned. For errors that warrant correction please contact the editor at editorial-team@simplywallst.com.
