
 Yahoo Finance
 Pacific Smiles Group Limited's (ASX:PSQ) Stock is Soaring But Financials Seem Inconsistent: Will The Uptrend Continue?

Pacific Smiles Group (ASX:PSQ) has had a great run on the share market with its stock up by a significant 59% over the last three months. However, we wonder if the company's inconsistent financials would have any adverse impact on the current share price momentum. Specifically, we decided to study Pacific Smiles Group's ROE in this article.
Return on Equity or ROE is a test of how effectively a company is growing its value and managing investors’ money. In other words, it is a profitability ratio which measures the rate of return on the capital provided by the company's shareholders.
Check out our latest analysis for Pacific Smiles Group
How To Calculate Return On Equity?
The formula for return on equity is:
Return on Equity = Net Profit (from continuing operations) ÷ Shareholders' Equity
So, based on the above formula, the ROE for Pacific Smiles Group is:
23% = AU$8.5m ÷ AU$36m (Based on the trailing twelve months to December 2019).
The 'return' refers to a company's earnings over the last year. One way to conceptualize this is that for each A$1 of shareholders' capital it has, the company made A$0.23 in profit.
What Is The Relationship Between ROE And Earnings Growth?
We have already established that ROE serves as an efficient profit-generating gauge for a company's future earnings. Depending on how much of these profits the company reinvests or "retains", and how effectively it does so, we are then able to assess a company’s earnings growth potential. Generally speaking, other things being equal, firms with a high return on equity and profit retention, have a higher growth rate than firms that don’t share these attributes.
A Side By Side comparison of Pacific Smiles Group's Earnings Growth And 23% ROE
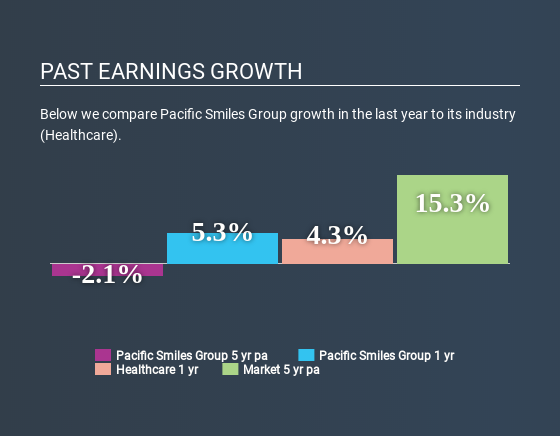
Firstly, we acknowledge that Pacific Smiles Group has a significantly high ROE. Second, a comparison with the average ROE reported by the industry of 11% also doesn't go unnoticed by us. As you might expect, the 2.1% net income decline reported by Pacific Smiles Group doesn't bode well with us. Based on this, we feel that there might be other reasons which haven't been discussed so far in this article that could be hampering the company's growth. These include low earnings retention or poor allocation of capital.
That being said, we compared Pacific Smiles Group's performance with the industry and were concerned when we found that while the company has shrunk its earnings, the industry has grown its earnings at a rate of 4.6% in the same period.
The basis for attaching value to a company is, to a great extent, tied to its earnings growth. What investors need to determine next is if the expected earnings growth, or the lack of it, is already built into the share price. This then helps them determine if the stock is placed for a bright or bleak future. Is PSQ fairly valued? This infographic on the company's intrinsic value has everything you need to know.
Is Pacific Smiles Group Making Efficient Use Of Its Profits?
With a three-year median payout ratio as high as 106%,Pacific Smiles Group's shrinking earnings don't come as a surprise as the company is paying a dividend which is beyond its means. Paying a dividend beyond their means is usually not viable over the long term. Our risks dashboard should have the 3 risks we have identified for Pacific Smiles Group.
In addition, Pacific Smiles Group has been paying dividends over a period of five years suggesting that keeping up dividend payments is preferred by the management even though earnings have been in decline. Existing analyst estimates suggest that the company's future payout ratio is expected to drop to 84% over the next three years. Regardless, the ROE is not expected to change much for the company despite the lower expected payout ratio.
Summary
Overall, we have mixed feelings about Pacific Smiles Group. While the company does have a high rate of return, its low earnings retention is probably what's hampering its earnings growth. Having said that, looking at current analyst estimates, we found that the company's earnings growth rate is expected to see a huge improvement. To know more about the latest analysts predictions for the company, check out this visualization of analyst forecasts for the company.
This article by Simply Wall St is general in nature. It does not constitute a recommendation to buy or sell any stock, and does not take account of your objectives, or your financial situation. We aim to bring you long-term focused analysis driven by fundamental data. Note that our analysis may not factor in the latest price-sensitive company announcements or qualitative material. Simply Wall St has no position in any stocks mentioned.
Have feedback on this article? Concerned about the content? Get in touch with us directly. Alternatively, email editorial-team@simplywallst.com.
