
 Yahoo Finance
 Parkmead Group (LON:PMG) Is Doing The Right Things To Multiply Its Share Price
To find a multi-bagger stock, what are the underlying trends we should look for in a business? In a perfect world, we'd like to see a company investing more capital into its business and ideally the returns earned from that capital are also increasing. This shows us that it's a compounding machine, able to continually reinvest its earnings back into the business and generate higher returns. Speaking of which, we noticed some great changes in Parkmead Group's (LON:PMG) returns on capital, so let's have a look.
Return On Capital Employed (ROCE): What Is It?
Just to clarify if you're unsure, ROCE is a metric for evaluating how much pre-tax income (in percentage terms) a company earns on the capital invested in its business. The formula for this calculation on Parkmead Group is:
Return on Capital Employed = Earnings Before Interest and Tax (EBIT) ÷ (Total Assets - Current Liabilities)
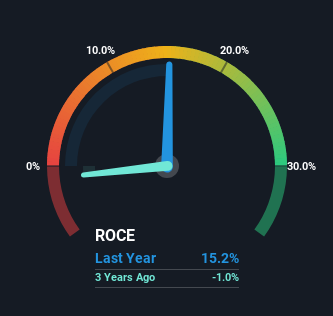
0.15 = UK£8.0m ÷ (UK£70m - UK£18m) (Based on the trailing twelve months to December 2022).
Thus, Parkmead Group has an ROCE of 15%. In absolute terms, that's a satisfactory return, but compared to the Oil and Gas industry average of 11% it's much better.
Check out our latest analysis for Parkmead Group
While the past is not representative of the future, it can be helpful to know how a company has performed historically, which is why we have this chart above. If you're interested in investigating Parkmead Group's past further, check out this free graph of past earnings, revenue and cash flow.
What Can We Tell From Parkmead Group's ROCE Trend?
Like most people, we're pleased that Parkmead Group is now generating some pretax earnings. While the business is profitable now, it used to be incurring losses on invested capital five years ago. In regards to capital employed, Parkmead Group is using 28% less capital than it was five years ago, which on the surface, can indicate that the business has become more efficient at generating these returns. The reduction could indicate that the company is selling some assets, and considering returns are up, they appear to be selling the right ones.
For the record though, there was a noticeable increase in the company's current liabilities over the period, so we would attribute some of the ROCE growth to that. Effectively this means that suppliers or short-term creditors are now funding 26% of the business, which is more than it was five years ago. It's worth keeping an eye on this because as the percentage of current liabilities to total assets increases, some aspects of risk also increase.
What We Can Learn From Parkmead Group's ROCE
In summary, it's great to see that Parkmead Group has been able to turn things around and earn higher returns on lower amounts of capital. And since the stock has dived 74% over the last five years, there may be other factors affecting the company's prospects. Regardless, we think the underlying fundamentals warrant this stock for further investigation.
Parkmead Group does come with some risks though, we found 3 warning signs in our investment analysis, and 1 of those can't be ignored...
While Parkmead Group may not currently earn the highest returns, we've compiled a list of companies that currently earn more than 25% return on equity. Check out this free list here.
Have feedback on this article? Concerned about the content? Get in touch with us directly. Alternatively, email editorial-team (at) simplywallst.com.
This article by Simply Wall St is general in nature. We provide commentary based on historical data and analyst forecasts only using an unbiased methodology and our articles are not intended to be financial advice. It does not constitute a recommendation to buy or sell any stock, and does not take account of your objectives, or your financial situation. We aim to bring you long-term focused analysis driven by fundamental data. Note that our analysis may not factor in the latest price-sensitive company announcements or qualitative material. Simply Wall St has no position in any stocks mentioned.
