
 Yahoo Finance
 The past year for Allreal Holding (VTX:ALLN) investors has not been profitable
Investors can approximate the average market return by buying an index fund. Active investors aim to buy stocks that vastly outperform the market - but in the process, they risk under-performance. Unfortunately the Allreal Holding AG (VTX:ALLN) share price slid 25% over twelve months. That falls noticeably short of the market decline of around 13%. Even if shareholders bought some time ago, they wouldn't be particularly happy: the stock is down 23% in three years.
It's worthwhile assessing if the company's economics have been moving in lockstep with these underwhelming shareholder returns, or if there is some disparity between the two. So let's do just that.
See our latest analysis for Allreal Holding
While markets are a powerful pricing mechanism, share prices reflect investor sentiment, not just underlying business performance. One flawed but reasonable way to assess how sentiment around a company has changed is to compare the earnings per share (EPS) with the share price.
Unhappily, Allreal Holding had to report a 22% decline in EPS over the last year. We note that the 25% share price drop is very close to the EPS drop. Therefore one could posit that the market has not become more concerned about the company, despite the lower EPS. Rather, the share price has approximately tracked EPS growth.
The image below shows how EPS has tracked over time (if you click on the image you can see greater detail).
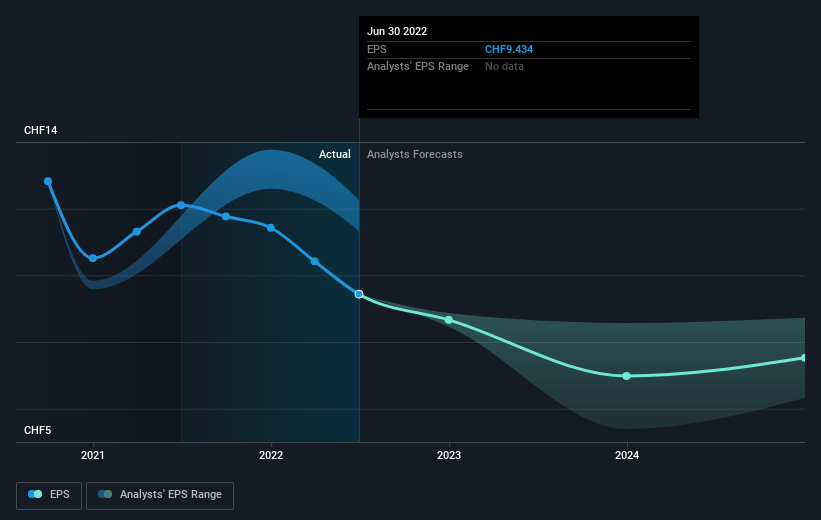
Dive deeper into Allreal Holding's key metrics by checking this interactive graph of Allreal Holding's earnings, revenue and cash flow.
What About Dividends?
As well as measuring the share price return, investors should also consider the total shareholder return (TSR). The TSR incorporates the value of any spin-offs or discounted capital raisings, along with any dividends, based on the assumption that the dividends are reinvested. It's fair to say that the TSR gives a more complete picture for stocks that pay a dividend. In the case of Allreal Holding, it has a TSR of -23% for the last 1 year. That exceeds its share price return that we previously mentioned. And there's no prize for guessing that the dividend payments largely explain the divergence!
A Different Perspective
While the broader market lost about 13% in the twelve months, Allreal Holding shareholders did even worse, losing 23% (even including dividends). However, it could simply be that the share price has been impacted by broader market jitters. It might be worth keeping an eye on the fundamentals, in case there's a good opportunity. On the bright side, long term shareholders have made money, with a gain of 1.1% per year over half a decade. If the fundamental data continues to indicate long term sustainable growth, the current sell-off could be an opportunity worth considering. It's always interesting to track share price performance over the longer term. But to understand Allreal Holding better, we need to consider many other factors. Even so, be aware that Allreal Holding is showing 2 warning signs in our investment analysis , you should know about...
We will like Allreal Holding better if we see some big insider buys. While we wait, check out this free list of growing companies with considerable, recent, insider buying.
Please note, the market returns quoted in this article reflect the market weighted average returns of stocks that currently trade on CH exchanges.
Have feedback on this article? Concerned about the content? Get in touch with us directly. Alternatively, email editorial-team (at) simplywallst.com.
This article by Simply Wall St is general in nature. We provide commentary based on historical data and analyst forecasts only using an unbiased methodology and our articles are not intended to be financial advice. It does not constitute a recommendation to buy or sell any stock, and does not take account of your objectives, or your financial situation. We aim to bring you long-term focused analysis driven by fundamental data. Note that our analysis may not factor in the latest price-sensitive company announcements or qualitative material. Simply Wall St has no position in any stocks mentioned.
Join A Paid User Research Session
You’ll receive a US$30 Amazon Gift card for 1 hour of your time while helping us build better investing tools for the individual investors like yourself. Sign up here
