
 Yahoo Finance
 The past five years for BGC Partners (NASDAQ:BGCP) investors has not been profitable
The main aim of stock picking is to find the market-beating stocks. But every investor is virtually certain to have both over-performing and under-performing stocks. At this point some shareholders may be questioning their investment in BGC Partners, Inc. (NASDAQ:BGCP), since the last five years saw the share price fall 73%. And we doubt long term believers are the only worried holders, since the stock price has declined 43% over the last twelve months. Shareholders have had an even rougher run lately, with the share price down 26% in the last 90 days. But this could be related to the weak market, which is down 17% in the same period.
So let's have a look and see if the longer term performance of the company has been in line with the underlying business' progress.
View our latest analysis for BGC Partners
While markets are a powerful pricing mechanism, share prices reflect investor sentiment, not just underlying business performance. One flawed but reasonable way to assess how sentiment around a company has changed is to compare the earnings per share (EPS) with the share price.
During the five years over which the share price declined, BGC Partners' earnings per share (EPS) dropped by 18% each year. Readers should note that the share price has fallen faster than the EPS, at a rate of 23% per year, over the period. This implies that the market was previously too optimistic about the stock. The less favorable sentiment is reflected in its current P/E ratio of 11.53.
The image below shows how EPS has tracked over time (if you click on the image you can see greater detail).
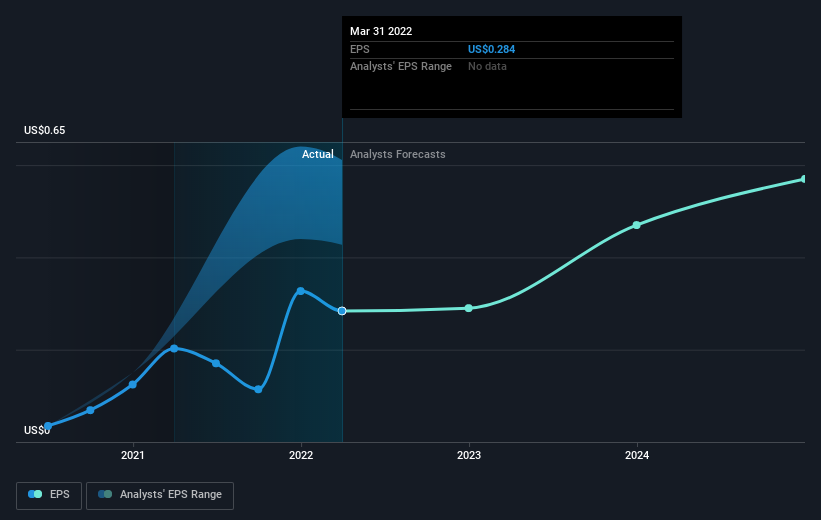
We know that BGC Partners has improved its bottom line lately, but is it going to grow revenue? You could check out this free report showing analyst revenue forecasts.
What About Dividends?
It is important to consider the total shareholder return, as well as the share price return, for any given stock. The TSR is a return calculation that accounts for the value of cash dividends (assuming that any dividend received was reinvested) and the calculated value of any discounted capital raisings and spin-offs. It's fair to say that the TSR gives a more complete picture for stocks that pay a dividend. As it happens, BGC Partners' TSR for the last 5 years was -46%, which exceeds the share price return mentioned earlier. And there's no prize for guessing that the dividend payments largely explain the divergence!
A Different Perspective
While the broader market lost about 19% in the twelve months, BGC Partners shareholders did even worse, losing 42% (even including dividends). However, it could simply be that the share price has been impacted by broader market jitters. It might be worth keeping an eye on the fundamentals, in case there's a good opportunity. Regrettably, last year's performance caps off a bad run, with the shareholders facing a total loss of 8% per year over five years. Generally speaking long term share price weakness can be a bad sign, though contrarian investors might want to research the stock in hope of a turnaround. I find it very interesting to look at share price over the long term as a proxy for business performance. But to truly gain insight, we need to consider other information, too. Even so, be aware that BGC Partners is showing 3 warning signs in our investment analysis , you should know about...
If you are like me, then you will not want to miss this free list of growing companies that insiders are buying.
Please note, the market returns quoted in this article reflect the market weighted average returns of stocks that currently trade on US exchanges.
Have feedback on this article? Concerned about the content? Get in touch with us directly. Alternatively, email editorial-team (at) simplywallst.com.
This article by Simply Wall St is general in nature. We provide commentary based on historical data and analyst forecasts only using an unbiased methodology and our articles are not intended to be financial advice. It does not constitute a recommendation to buy or sell any stock, and does not take account of your objectives, or your financial situation. We aim to bring you long-term focused analysis driven by fundamental data. Note that our analysis may not factor in the latest price-sensitive company announcements or qualitative material. Simply Wall St has no position in any stocks mentioned.
