
 Yahoo Finance
 The past five years for Card Factory (LON:CARD) investors has not been profitable
We're definitely into long term investing, but some companies are simply bad investments over any time frame. We don't wish catastrophic capital loss on anyone. Spare a thought for those who held Card Factory plc (LON:CARD) for five whole years - as the share price tanked 81%. We really hope anyone holding through that price crash has a diversified portfolio. Even when you lose money, you don't have to lose the lesson.
Now let's have a look at the company's fundamentals, and see if the long term shareholder return has matched the performance of the underlying business.
View our latest analysis for Card Factory
While markets are a powerful pricing mechanism, share prices reflect investor sentiment, not just underlying business performance. One imperfect but simple way to consider how the market perception of a company has shifted is to compare the change in the earnings per share (EPS) with the share price movement.
In the last half decade Card Factory saw its share price fall as its EPS declined below zero. Since the company has fallen to a loss making position, it's hard to compare the change in EPS with the share price change. However, we can say we'd expect to see a falling share price in this scenario.
The company's earnings per share (over time) is depicted in the image below (click to see the exact numbers).
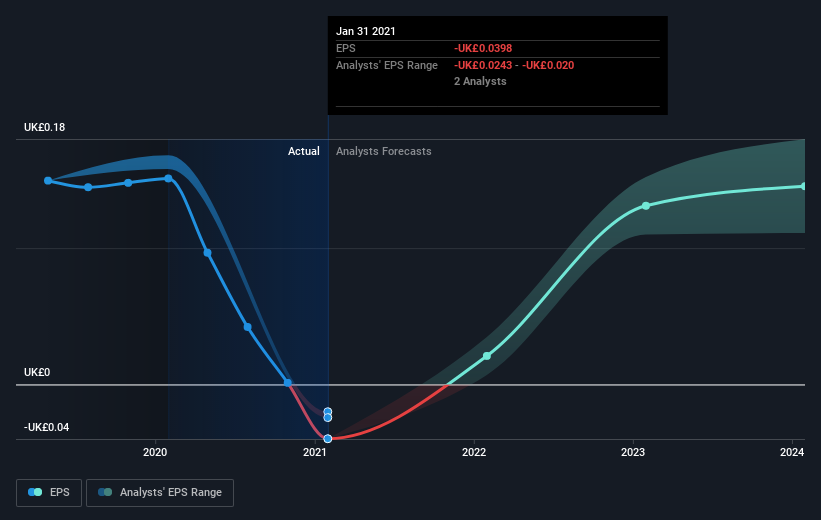
Dive deeper into Card Factory's key metrics by checking this interactive graph of Card Factory's earnings, revenue and cash flow.
What about the Total Shareholder Return (TSR)?
We've already covered Card Factory's share price action, but we should also mention its total shareholder return (TSR). Arguably the TSR is a more complete return calculation because it accounts for the value of dividends (as if they were reinvested), along with the hypothetical value of any discounted capital that have been offered to shareholders. Card Factory's TSR of was a loss of 74% for the 5 years. That wasn't as bad as its share price return, because it has paid dividends.
A Different Perspective
It's nice to see that Card Factory shareholders have received a total shareholder return of 57% over the last year. Notably the five-year annualised TSR loss of 12% per year compares very unfavourably with the recent share price performance. We generally put more weight on the long term performance over the short term, but the recent improvement could hint at a (positive) inflection point within the business. It's always interesting to track share price performance over the longer term. But to understand Card Factory better, we need to consider many other factors. For example, we've discovered 1 warning sign for Card Factory that you should be aware of before investing here.
Of course, you might find a fantastic investment by looking elsewhere. So take a peek at this free list of companies we expect will grow earnings.
Please note, the market returns quoted in this article reflect the market weighted average returns of stocks that currently trade on GB exchanges.
This article by Simply Wall St is general in nature. We provide commentary based on historical data and analyst forecasts only using an unbiased methodology and our articles are not intended to be financial advice. It does not constitute a recommendation to buy or sell any stock, and does not take account of your objectives, or your financial situation. We aim to bring you long-term focused analysis driven by fundamental data. Note that our analysis may not factor in the latest price-sensitive company announcements or qualitative material. Simply Wall St has no position in any stocks mentioned.
Have feedback on this article? Concerned about the content? Get in touch with us directly. Alternatively, email editorial-team (at) simplywallst.com.
