
 Yahoo Finance
 The past five years for Chorus Aviation (TSE:CHR) investors has not been profitable
We think intelligent long term investing is the way to go. But along the way some stocks are going to perform badly. For example the Chorus Aviation Inc. (TSE:CHR) share price dropped 59% over five years. That is extremely sub-optimal, to say the least.
So let's have a look and see if the longer term performance of the company has been in line with the underlying business' progress.
Check out our latest analysis for Chorus Aviation
While markets are a powerful pricing mechanism, share prices reflect investor sentiment, not just underlying business performance. One way to examine how market sentiment has changed over time is to look at the interaction between a company's share price and its earnings per share (EPS).
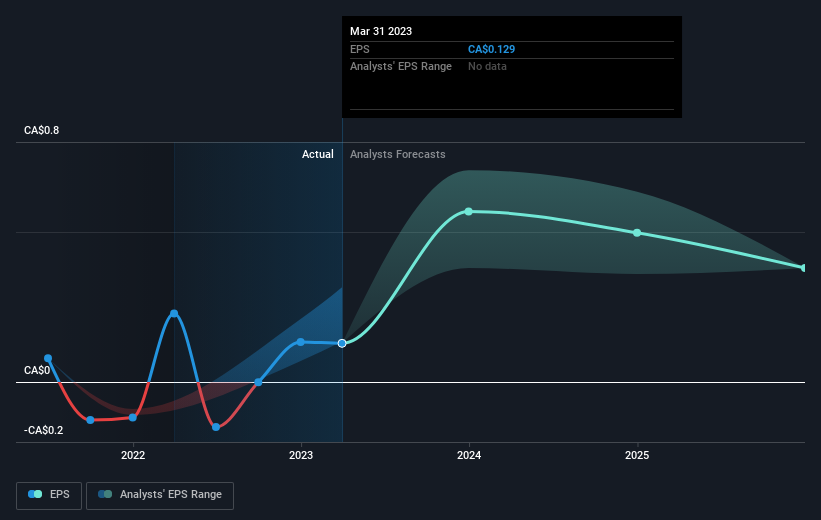
Looking back five years, both Chorus Aviation's share price and EPS declined; the latter at a rate of 36% per year. This fall in the EPS is worse than the 16% compound annual share price fall. The relatively muted share price reaction might be because the market expects the business to turn around.
You can see below how EPS has changed over time (discover the exact values by clicking on the image).
We like that insiders have been buying shares in the last twelve months. Even so, future earnings will be far more important to whether current shareholders make money. This free interactive report on Chorus Aviation's earnings, revenue and cash flow is a great place to start, if you want to investigate the stock further.
What About The Total Shareholder Return (TSR)?
We've already covered Chorus Aviation's share price action, but we should also mention its total shareholder return (TSR). Arguably the TSR is a more complete return calculation because it accounts for the value of dividends (as if they were reinvested), along with the hypothetical value of any discounted capital that have been offered to shareholders. Dividends have been really beneficial for Chorus Aviation shareholders, and that cash payout explains why its total shareholder loss of 53%, over the last 5 years, isn't as bad as the share price return.
A Different Perspective
Chorus Aviation shareholders gained a total return of 4.0% during the year. Unfortunately this falls short of the market return. On the bright side, that's still a gain, and it is certainly better than the yearly loss of about 9% endured over half a decade. It could well be that the business is stabilizing. It's always interesting to track share price performance over the longer term. But to understand Chorus Aviation better, we need to consider many other factors. Case in point: We've spotted 3 warning signs for Chorus Aviation you should be aware of, and 1 of them can't be ignored.
Chorus Aviation is not the only stock that insiders are buying. For those who like to find winning investments this free list of growing companies with recent insider purchasing, could be just the ticket.
Please note, the market returns quoted in this article reflect the market weighted average returns of stocks that currently trade on Canadian exchanges.
Have feedback on this article? Concerned about the content? Get in touch with us directly. Alternatively, email editorial-team (at) simplywallst.com.
This article by Simply Wall St is general in nature. We provide commentary based on historical data and analyst forecasts only using an unbiased methodology and our articles are not intended to be financial advice. It does not constitute a recommendation to buy or sell any stock, and does not take account of your objectives, or your financial situation. We aim to bring you long-term focused analysis driven by fundamental data. Note that our analysis may not factor in the latest price-sensitive company announcements or qualitative material. Simply Wall St has no position in any stocks mentioned.
Join A Paid User Research Session
You’ll receive a US$30 Amazon Gift card for 1 hour of your time while helping us build better investing tools for the individual investors like yourself. Sign up here
