
 Yahoo Finance
 The past five years for K3 Business Technology Group (LON:KBT) investors has not been profitable
Generally speaking long term investing is the way to go. But along the way some stocks are going to perform badly. For example, after five long years the K3 Business Technology Group plc (LON:KBT) share price is a whole 53% lower. We certainly feel for shareholders who bought near the top.
It's worthwhile assessing if the company's economics have been moving in lockstep with these underwhelming shareholder returns, or if there is some disparity between the two. So let's do just that.
View our latest analysis for K3 Business Technology Group
K3 Business Technology Group isn't currently profitable, so most analysts would look to revenue growth to get an idea of how fast the underlying business is growing. Shareholders of unprofitable companies usually desire strong revenue growth. As you can imagine, fast revenue growth, when maintained, often leads to fast profit growth.
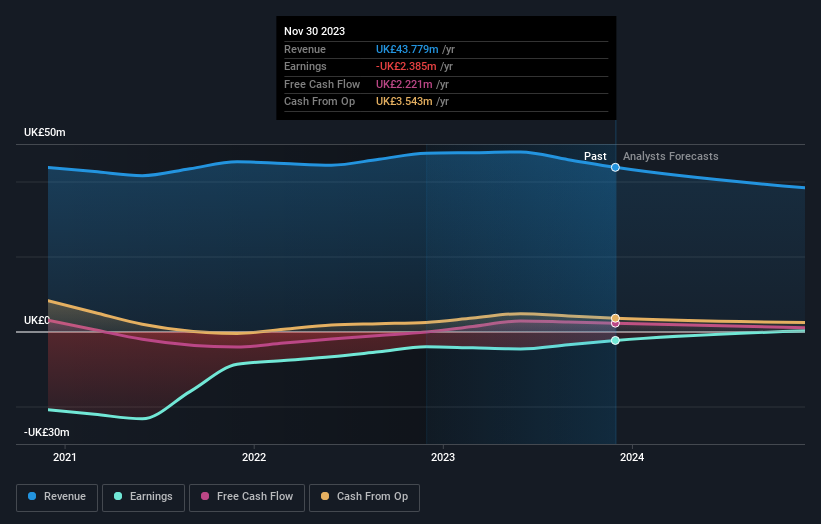
In the last five years K3 Business Technology Group saw its revenue shrink by 9.8% per year. That's definitely a weaker result than most pre-profit companies report. Arguably, the market has responded appropriately to this business performance by sending the share price down 9% (annualized) in the same time period. We don't generally like to own companies that lose money and don't grow revenues. You might be better off spending your money on a leisure activity. You'd want to research this company pretty thoroughly before buying, it looks a bit too risky for us.
You can see how earnings and revenue have changed over time in the image below (click on the chart to see the exact values).
You can see how its balance sheet has strengthened (or weakened) over time in this free interactive graphic.
A Different Perspective
Investors in K3 Business Technology Group had a tough year, with a total loss of 8.0%, against a market gain of about 7.4%. Even the share prices of good stocks drop sometimes, but we want to see improvements in the fundamental metrics of a business, before getting too interested. Unfortunately, longer term shareholders are suffering worse, given the loss of 9% doled out over the last five years. We'd need to see some sustained improvements in the key metrics before we could muster much enthusiasm. While it is well worth considering the different impacts that market conditions can have on the share price, there are other factors that are even more important. To that end, you should learn about the 2 warning signs we've spotted with K3 Business Technology Group (including 1 which is potentially serious) .
Of course K3 Business Technology Group may not be the best stock to buy. So you may wish to see this free collection of growth stocks.
Please note, the market returns quoted in this article reflect the market weighted average returns of stocks that currently trade on British exchanges.
Have feedback on this article? Concerned about the content? Get in touch with us directly. Alternatively, email editorial-team (at) simplywallst.com.
This article by Simply Wall St is general in nature. We provide commentary based on historical data and analyst forecasts only using an unbiased methodology and our articles are not intended to be financial advice. It does not constitute a recommendation to buy or sell any stock, and does not take account of your objectives, or your financial situation. We aim to bring you long-term focused analysis driven by fundamental data. Note that our analysis may not factor in the latest price-sensitive company announcements or qualitative material. Simply Wall St has no position in any stocks mentioned.
