
 Yahoo Finance
 The past five years for Kandi Technologies Group (NASDAQ:KNDI) investors has not been profitable
Generally speaking long term investing is the way to go. But no-one is immune from buying too high. For example the Kandi Technologies Group, Inc. (NASDAQ:KNDI) share price dropped 65% over five years. That is extremely sub-optimal, to say the least. We also note that the stock has performed poorly over the last year, with the share price down 54%. Furthermore, it's down 23% in about a quarter. That's not much fun for holders.
Now let's have a look at the company's fundamentals, and see if the long term shareholder return has matched the performance of the underlying business.
Check out our latest analysis for Kandi Technologies Group
Kandi Technologies Group wasn't profitable in the last twelve months, it is unlikely we'll see a strong correlation between its share price and its earnings per share (EPS). Arguably revenue is our next best option. Shareholders of unprofitable companies usually expect strong revenue growth. As you can imagine, fast revenue growth, when maintained, often leads to fast profit growth.
Over five years, Kandi Technologies Group grew its revenue at 0.5% per year. That's not a very high growth rate considering it doesn't make profits. It's likely this weak growth has contributed to an annualised return of 11% for the last five years. We'd want to see proof that future revenue growth is likely to be significantly stronger before getting too interested in Kandi Technologies Group. However, it's possible too many in the market will ignore it, and there may be an opportunity if it starts to recover down the track.
The image below shows how earnings and revenue have tracked over time (if you click on the image you can see greater detail).
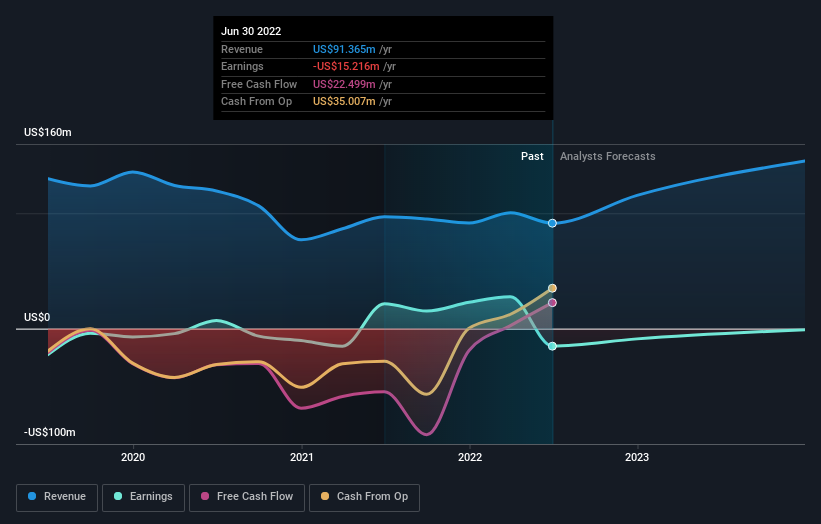
We're pleased to report that the CEO is remunerated more modestly than most CEOs at similarly capitalized companies. It's always worth keeping an eye on CEO pay, but a more important question is whether the company will grow earnings throughout the years. If you are thinking of buying or selling Kandi Technologies Group stock, you should check out this free report showing analyst profit forecasts.
A Different Perspective
We regret to report that Kandi Technologies Group shareholders are down 54% for the year. Unfortunately, that's worse than the broader market decline of 22%. Having said that, it's inevitable that some stocks will be oversold in a falling market. The key is to keep your eyes on the fundamental developments. Unfortunately, last year's performance may indicate unresolved challenges, given that it was worse than the annualised loss of 11% over the last half decade. Generally speaking long term share price weakness can be a bad sign, though contrarian investors might want to research the stock in hope of a turnaround. While it is well worth considering the different impacts that market conditions can have on the share price, there are other factors that are even more important. To that end, you should be aware of the 1 warning sign we've spotted with Kandi Technologies Group .
If you like to buy stocks alongside management, then you might just love this free list of companies. (Hint: insiders have been buying them).
Please note, the market returns quoted in this article reflect the market weighted average returns of stocks that currently trade on US exchanges.
Have feedback on this article? Concerned about the content? Get in touch with us directly. Alternatively, email editorial-team (at) simplywallst.com.
This article by Simply Wall St is general in nature. We provide commentary based on historical data and analyst forecasts only using an unbiased methodology and our articles are not intended to be financial advice. It does not constitute a recommendation to buy or sell any stock, and does not take account of your objectives, or your financial situation. We aim to bring you long-term focused analysis driven by fundamental data. Note that our analysis may not factor in the latest price-sensitive company announcements or qualitative material. Simply Wall St has no position in any stocks mentioned.
Join A Paid User Research Session
You’ll receive a US$30 Amazon Gift card for 1 hour of your time while helping us build better investing tools for the individual investors like yourself. Sign up here
