
 Yahoo Finance
 The past five years for Kier Group (LON:KIE) investors has not been profitable
Kier Group plc (LON:KIE) shareholders should be happy to see the share price up 24% in the last quarter. But will that heal all the wounds inflicted over 5 years of declines? Unlikely. Indeed, the share price is down a whopping 92% in that time. The recent bounce might mean the long decline is over, but we are not confident. The million dollar question is whether the company can justify a long term recovery. We really hope anyone holding through that price crash has a diversified portfolio. Even when you lose money, you don't have to lose the lesson.
So let's have a look and see if the longer term performance of the company has been in line with the underlying business' progress.
Check out our latest analysis for Kier Group
To paraphrase Benjamin Graham: Over the short term the market is a voting machine, but over the long term it's a weighing machine. One imperfect but simple way to consider how the market perception of a company has shifted is to compare the change in the earnings per share (EPS) with the share price movement.
Kier Group became profitable within the last five years. That would generally be considered a positive, so we are surprised to see the share price is down. Other metrics might give us a better handle on how its value is changing over time.
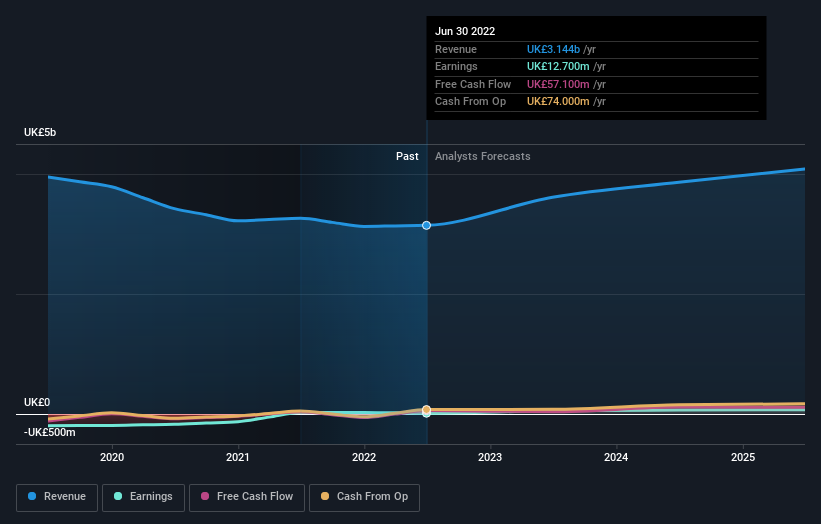
Arguably, the revenue drop of 7.4% a year for half a decade suggests that the company can't grow in the long term. That could explain the weak share price.
The graphic below depicts how earnings and revenue have changed over time (unveil the exact values by clicking on the image).
We know that Kier Group has improved its bottom line over the last three years, but what does the future have in store? Take a more thorough look at Kier Group's financial health with this free report on its balance sheet.
What About The Total Shareholder Return (TSR)?
We'd be remiss not to mention the difference between Kier Group's total shareholder return (TSR) and its share price return. The TSR attempts to capture the value of dividends (as if they were reinvested) as well as any spin-offs or discounted capital raisings offered to shareholders. Dividends have been really beneficial for Kier Group shareholders, and that cash payout explains why its total shareholder loss of 90%, over the last 5 years, isn't as bad as the share price return.
A Different Perspective
Investors in Kier Group had a tough year, with a total loss of 15%, against a market gain of about 2.4%. Even the share prices of good stocks drop sometimes, but we want to see improvements in the fundamental metrics of a business, before getting too interested. However, the loss over the last year isn't as bad as the 14% per annum loss investors have suffered over the last half decade. We would want clear information suggesting the company will grow, before taking the view that the share price will stabilize. I find it very interesting to look at share price over the long term as a proxy for business performance. But to truly gain insight, we need to consider other information, too. Take risks, for example - Kier Group has 1 warning sign we think you should be aware of.
If you like to buy stocks alongside management, then you might just love this free list of companies. (Hint: insiders have been buying them).
Please note, the market returns quoted in this article reflect the market weighted average returns of stocks that currently trade on GB exchanges.
Have feedback on this article? Concerned about the content? Get in touch with us directly. Alternatively, email editorial-team (at) simplywallst.com.
This article by Simply Wall St is general in nature. We provide commentary based on historical data and analyst forecasts only using an unbiased methodology and our articles are not intended to be financial advice. It does not constitute a recommendation to buy or sell any stock, and does not take account of your objectives, or your financial situation. We aim to bring you long-term focused analysis driven by fundamental data. Note that our analysis may not factor in the latest price-sensitive company announcements or qualitative material. Simply Wall St has no position in any stocks mentioned.
Join A Paid User Research Session
You’ll receive a US$30 Amazon Gift card for 1 hour of your time while helping us build better investing tools for the individual investors like yourself. Sign up here
