
 Yahoo Finance
 The past five years for Mountain Province Diamonds (TSE:MPVD) investors has not been profitable
Some stocks are best avoided. We don't wish catastrophic capital loss on anyone. For example, we sympathize with anyone who was caught holding Mountain Province Diamonds Inc. (TSE:MPVD) during the five years that saw its share price drop a whopping 84%. We really feel for shareholders in this scenario. It's a good reminder of the importance of diversification, and it's worth keeping in mind there's more to life than money, anyway.
It's worthwhile assessing if the company's economics have been moving in lockstep with these underwhelming shareholder returns, or if there is some disparity between the two. So let's do just that.
Check out our latest analysis for Mountain Province Diamonds
To paraphrase Benjamin Graham: Over the short term the market is a voting machine, but over the long term it's a weighing machine. By comparing earnings per share (EPS) and share price changes over time, we can get a feel for how investor attitudes to a company have morphed over time.
Mountain Province Diamonds became profitable within the last five years. Most would consider that to be a good thing, so it's counter-intuitive to see the share price declining. Other metrics may better explain the share price move.
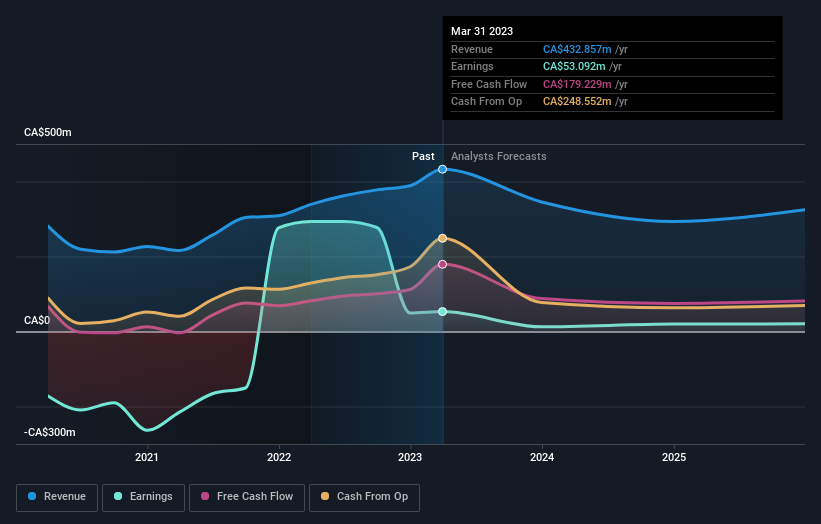
In contrast to the share price, revenue has actually increased by 6.4% a year in the five year period. A more detailed examination of the revenue and earnings may or may not explain why the share price languishes; there could be an opportunity.
The graphic below depicts how earnings and revenue have changed over time (unveil the exact values by clicking on the image).
We know that Mountain Province Diamonds has improved its bottom line over the last three years, but what does the future have in store? This free interactive report on Mountain Province Diamonds' balance sheet strength is a great place to start, if you want to investigate the stock further.
A Different Perspective
While the broader market gained around 4.8% in the last year, Mountain Province Diamonds shareholders lost 13%. Even the share prices of good stocks drop sometimes, but we want to see improvements in the fundamental metrics of a business, before getting too interested. Unfortunately, longer term shareholders are suffering worse, given the loss of 13% doled out over the last five years. We'd need to see some sustained improvements in the key metrics before we could muster much enthusiasm. It's always interesting to track share price performance over the longer term. But to understand Mountain Province Diamonds better, we need to consider many other factors. To that end, you should learn about the 4 warning signs we've spotted with Mountain Province Diamonds (including 1 which makes us a bit uncomfortable) .
If you like to buy stocks alongside management, then you might just love this free list of companies. (Hint: insiders have been buying them).
Please note, the market returns quoted in this article reflect the market weighted average returns of stocks that currently trade on Canadian exchanges.
Have feedback on this article? Concerned about the content? Get in touch with us directly. Alternatively, email editorial-team (at) simplywallst.com.
This article by Simply Wall St is general in nature. We provide commentary based on historical data and analyst forecasts only using an unbiased methodology and our articles are not intended to be financial advice. It does not constitute a recommendation to buy or sell any stock, and does not take account of your objectives, or your financial situation. We aim to bring you long-term focused analysis driven by fundamental data. Note that our analysis may not factor in the latest price-sensitive company announcements or qualitative material. Simply Wall St has no position in any stocks mentioned.
