
 Yahoo Finance
 The past five years for Pollen Street (LON:POLN) investors has not been profitable
Pollen Street PLC (LON:POLN) shareholders should be happy to see the share price up 25% in the last quarter. But that doesn't change the fact that the returns over the last five years have been less than pleasing. After all, the share price is down 37% in that time, significantly under-performing the market.
So let's have a look and see if the longer term performance of the company has been in line with the underlying business' progress.
View our latest analysis for Pollen Street
To paraphrase Benjamin Graham: Over the short term the market is a voting machine, but over the long term it's a weighing machine. One flawed but reasonable way to assess how sentiment around a company has changed is to compare the earnings per share (EPS) with the share price.
Looking back five years, both Pollen Street's share price and EPS declined; the latter at a rate of 13% per year. The share price decline of 9% per year isn't as bad as the EPS decline. So investors might expect EPS to bounce back -- or they may have previously foreseen the EPS decline.
The graphic below depicts how EPS has changed over time (unveil the exact values by clicking on the image).
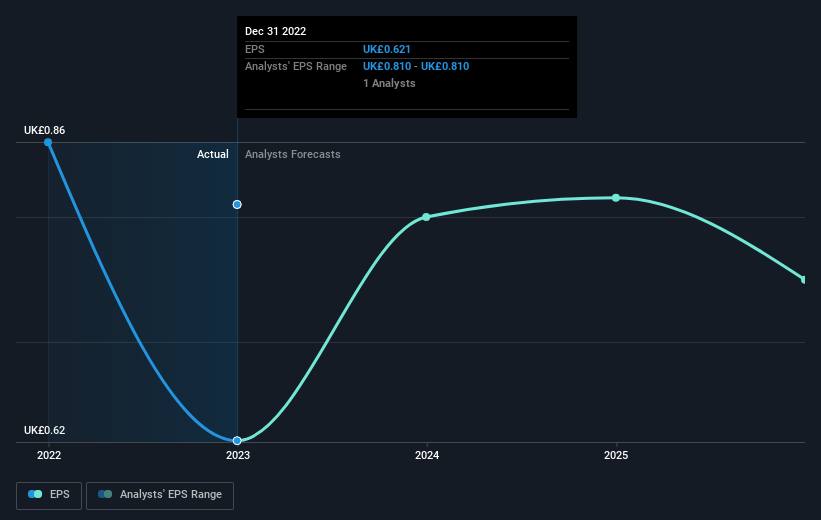
Dive deeper into Pollen Street's key metrics by checking this interactive graph of Pollen Street's earnings, revenue and cash flow.
What About Dividends?
As well as measuring the share price return, investors should also consider the total shareholder return (TSR). Whereas the share price return only reflects the change in the share price, the TSR includes the value of dividends (assuming they were reinvested) and the benefit of any discounted capital raising or spin-off. So for companies that pay a generous dividend, the TSR is often a lot higher than the share price return. As it happens, Pollen Street's TSR for the last 5 years was -3.5%, which exceeds the share price return mentioned earlier. The dividends paid by the company have thusly boosted the total shareholder return.
A Different Perspective
Investors in Pollen Street had a tough year, with a total loss of 16% (including dividends), against a market gain of about 7.7%. Even the share prices of good stocks drop sometimes, but we want to see improvements in the fundamental metrics of a business, before getting too interested. Regrettably, last year's performance caps off a bad run, with the shareholders facing a total loss of 0.7% per year over five years. We realise that Baron Rothschild has said investors should "buy when there is blood on the streets", but we caution that investors should first be sure they are buying a high quality business. I find it very interesting to look at share price over the long term as a proxy for business performance. But to truly gain insight, we need to consider other information, too. Case in point: We've spotted 3 warning signs for Pollen Street you should be aware of, and 1 of them shouldn't be ignored.
But note: Pollen Street may not be the best stock to buy. So take a peek at this free list of interesting companies with past earnings growth (and further growth forecast).
Please note, the market returns quoted in this article reflect the market weighted average returns of stocks that currently trade on British exchanges.
Have feedback on this article? Concerned about the content? Get in touch with us directly. Alternatively, email editorial-team (at) simplywallst.com.
This article by Simply Wall St is general in nature. We provide commentary based on historical data and analyst forecasts only using an unbiased methodology and our articles are not intended to be financial advice. It does not constitute a recommendation to buy or sell any stock, and does not take account of your objectives, or your financial situation. We aim to bring you long-term focused analysis driven by fundamental data. Note that our analysis may not factor in the latest price-sensitive company announcements or qualitative material. Simply Wall St has no position in any stocks mentioned.
Join A Paid User Research Session
You’ll receive a US$30 Amazon Gift card for 1 hour of your time while helping us build better investing tools for the individual investors like yourself. Sign up here
