
 Yahoo Finance
 The past one-year earnings decline for DoubleDown Interactive (NASDAQ:DDI) likely explains shareholders long-term losses
It's nice to see the DoubleDown Interactive Co., Ltd. (NASDAQ:DDI) share price up 13% in a week. But that doesn't change the reality of under-performance over the last twelve months. After all, the share price is down 39% in the last year, significantly under-performing the market.
While the stock has risen 13% in the past week but long term shareholders are still in the red, let's see what the fundamentals can tell us.
See our latest analysis for DoubleDown Interactive
To paraphrase Benjamin Graham: Over the short term the market is a voting machine, but over the long term it's a weighing machine. One imperfect but simple way to consider how the market perception of a company has shifted is to compare the change in the earnings per share (EPS) with the share price movement.
Unfortunately DoubleDown Interactive reported an EPS drop of 63% for the last year. The share price fall of 39% isn't as bad as the reduction in earnings per share. It may have been that the weak EPS was not as bad as some had feared.
You can see below how EPS has changed over time (discover the exact values by clicking on the image).
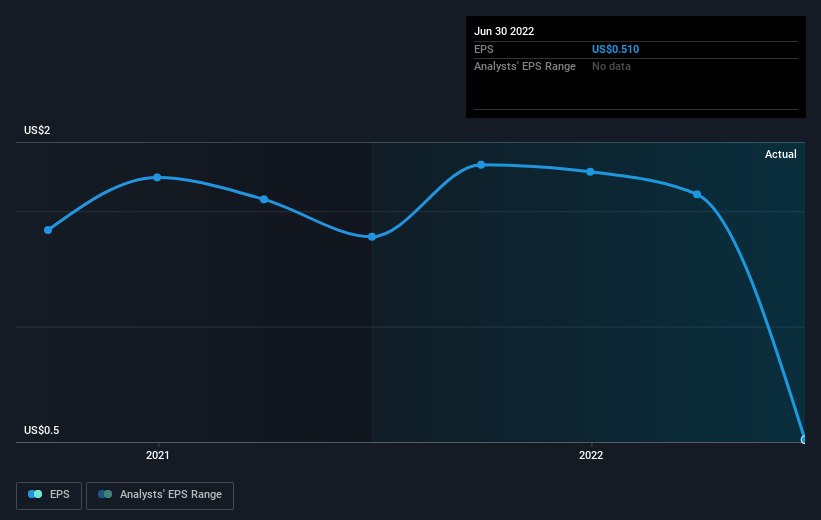
This free interactive report on DoubleDown Interactive's earnings, revenue and cash flow is a great place to start, if you want to investigate the stock further.
A Different Perspective
We doubt DoubleDown Interactive shareholders are happy with the loss of 39% over twelve months. That falls short of the market, which lost 16%. There's no doubt that's a disappointment, but the stock may well have fared better in a stronger market. With the stock down 2.2% over the last three months, the market doesn't seem to believe that the company has solved all its problems. Basically, most investors should be wary of buying into a poor-performing stock, unless the business itself has clearly improved. While it is well worth considering the different impacts that market conditions can have on the share price, there are other factors that are even more important. Consider for instance, the ever-present spectre of investment risk. We've identified 2 warning signs with DoubleDown Interactive (at least 1 which can't be ignored) , and understanding them should be part of your investment process.
But note: DoubleDown Interactive may not be the best stock to buy. So take a peek at this free list of interesting companies with past earnings growth (and further growth forecast).
Please note, the market returns quoted in this article reflect the market weighted average returns of stocks that currently trade on US exchanges.
Have feedback on this article? Concerned about the content? Get in touch with us directly. Alternatively, email editorial-team (at) simplywallst.com.
This article by Simply Wall St is general in nature. We provide commentary based on historical data and analyst forecasts only using an unbiased methodology and our articles are not intended to be financial advice. It does not constitute a recommendation to buy or sell any stock, and does not take account of your objectives, or your financial situation. We aim to bring you long-term focused analysis driven by fundamental data. Note that our analysis may not factor in the latest price-sensitive company announcements or qualitative material. Simply Wall St has no position in any stocks mentioned.
Join A Paid User Research Session
You’ll receive a US$30 Amazon Gift card for 1 hour of your time while helping us build better investing tools for the individual investors like yourself. Sign up here
