
 Yahoo Finance
 The past year for Prenetics Global (NASDAQ:PRE) investors has not been profitable
The simplest way to benefit from a rising market is to buy an index fund. Active investors aim to buy stocks that vastly outperform the market - but in the process, they risk under-performance. That downside risk was realized by Prenetics Global Limited (NASDAQ:PRE) shareholders over the last year, as the share price declined 47%. That contrasts poorly with the market decline of 10%. Prenetics Global hasn't been listed for long, so although we're wary of recent listings that perform poorly, it may still prove itself with time. In the last ninety days we've seen the share price slide 51%.
It's worthwhile assessing if the company's economics have been moving in lockstep with these underwhelming shareholder returns, or if there is some disparity between the two. So let's do just that.
View our latest analysis for Prenetics Global
Prenetics Global isn't currently profitable, so most analysts would look to revenue growth to get an idea of how fast the underlying business is growing. Shareholders of unprofitable companies usually expect strong revenue growth. That's because fast revenue growth can be easily extrapolated to forecast profits, often of considerable size.
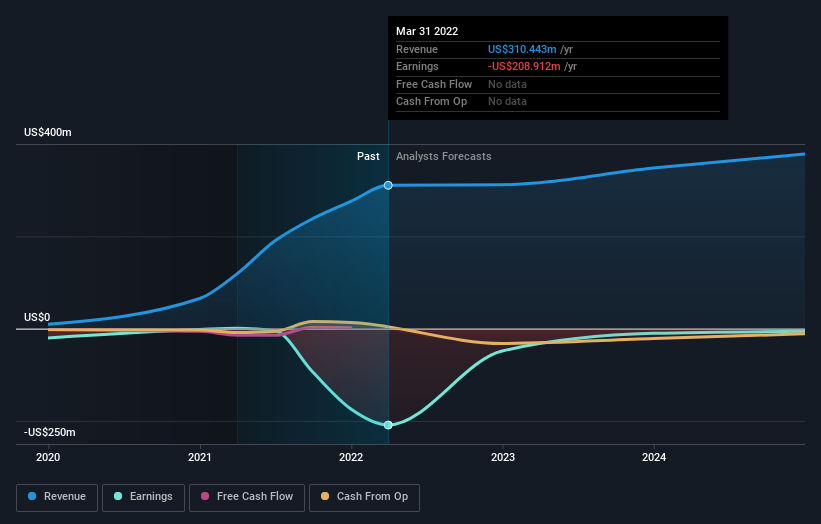
In the last year Prenetics Global saw its revenue grow by 162%. That's well above most other pre-profit companies. The share price drop of 47% over twelve months would be considered disappointing by many, so you might argue the company is getting little credit for its impressive revenue growth. On the bright side, if this company is moving profits in the right direction, top-line growth like that could be an opportunity. Our brains have evolved to think in linear fashion, so there's value in learning to recognize exponential growth. We are, in some ways, simply the wisest of the monkeys.
The image below shows how earnings and revenue have tracked over time (if you click on the image you can see greater detail).
If you are thinking of buying or selling Prenetics Global stock, you should check out this FREE detailed report on its balance sheet.
A Different Perspective
Prenetics Global shareholders are down 47% for the year, even worse than the market loss of 10%. There's no doubt that's a disappointment, but the stock may well have fared better in a stronger market. It's worth noting that the last three months did the real damage, with a 51% decline. This probably signals that the business has recently disappointed shareholders - it will take time to win them back. I find it very interesting to look at share price over the long term as a proxy for business performance. But to truly gain insight, we need to consider other information, too. To that end, you should learn about the 2 warning signs we've spotted with Prenetics Global (including 1 which doesn't sit too well with us) .
If you would prefer to check out another company -- one with potentially superior financials -- then do not miss this free list of companies that have proven they can grow earnings.
Please note, the market returns quoted in this article reflect the market weighted average returns of stocks that currently trade on US exchanges.
Have feedback on this article? Concerned about the content? Get in touch with us directly. Alternatively, email editorial-team (at) simplywallst.com.
This article by Simply Wall St is general in nature. We provide commentary based on historical data and analyst forecasts only using an unbiased methodology and our articles are not intended to be financial advice. It does not constitute a recommendation to buy or sell any stock, and does not take account of your objectives, or your financial situation. We aim to bring you long-term focused analysis driven by fundamental data. Note that our analysis may not factor in the latest price-sensitive company announcements or qualitative material. Simply Wall St has no position in any stocks mentioned.
Join A Paid User Research Session
You’ll receive a US$30 Amazon Gift card for 1 hour of your time while helping us build better investing tools for the individual investors like yourself. Sign up here