
 Yahoo Finance
 The past three years for Grainger (LON:GRI) investors has not been profitable
Grainger plc (LON:GRI) shareholders should be happy to see the share price up 22% in the last quarter. But that doesn't change the fact that the returns over the last three years have been less than pleasing. Truth be told the share price declined 15% in three years and that return, Dear Reader, falls short of what you could have got from passive investing with an index fund.
Since shareholders are down over the longer term, lets look at the underlying fundamentals over the that time and see if they've been consistent with returns.
View our latest analysis for Grainger
To paraphrase Benjamin Graham: Over the short term the market is a voting machine, but over the long term it's a weighing machine. One flawed but reasonable way to assess how sentiment around a company has changed is to compare the earnings per share (EPS) with the share price.
During the unfortunate three years of share price decline, Grainger actually saw its earnings per share (EPS) improve by 16% per year. Given the share price reaction, one might suspect that EPS is not a good guide to the business performance during the period (perhaps due to a one-off loss or gain). Alternatively, growth expectations may have been unreasonable in the past.
It's worth taking a look at other metrics, because the EPS growth doesn't seem to match with the falling share price.
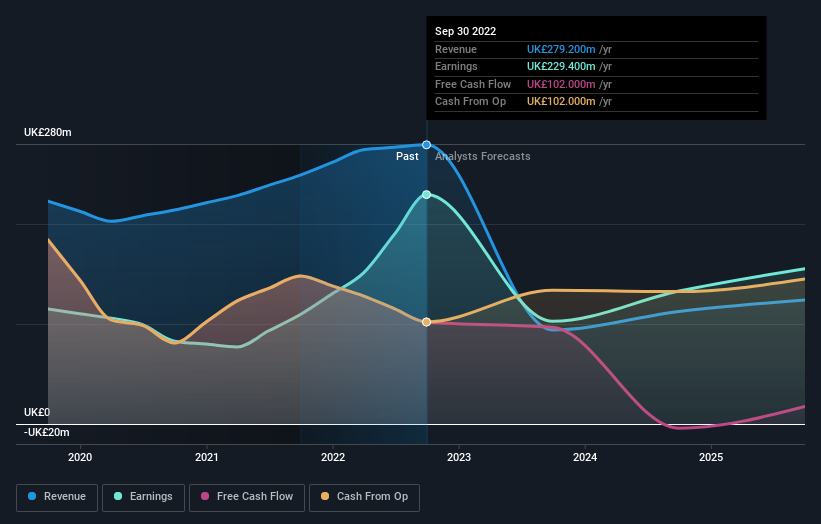
We note that, in three years, revenue has actually grown at a 11% annual rate, so that doesn't seem to be a reason to sell shares. It's probably worth investigating Grainger further; while we may be missing something on this analysis, there might also be an opportunity.
You can see how earnings and revenue have changed over time in the image below (click on the chart to see the exact values).
We know that Grainger has improved its bottom line lately, but what does the future have in store? You can see what analysts are predicting for Grainger in this interactive graph of future profit estimates.
What About Dividends?
It is important to consider the total shareholder return, as well as the share price return, for any given stock. The TSR incorporates the value of any spin-offs or discounted capital raisings, along with any dividends, based on the assumption that the dividends are reinvested. Arguably, the TSR gives a more comprehensive picture of the return generated by a stock. In the case of Grainger, it has a TSR of -9.4% for the last 3 years. That exceeds its share price return that we previously mentioned. This is largely a result of its dividend payments!
A Different Perspective
While the broader market lost about 1.5% in the twelve months, Grainger shareholders did even worse, losing 13% (even including dividends). Having said that, it's inevitable that some stocks will be oversold in a falling market. The key is to keep your eyes on the fundamental developments. On the bright side, long term shareholders have made money, with a gain of 2% per year over half a decade. It could be that the recent sell-off is an opportunity, so it may be worth checking the fundamental data for signs of a long term growth trend. It's always interesting to track share price performance over the longer term. But to understand Grainger better, we need to consider many other factors. Even so, be aware that Grainger is showing 3 warning signs in our investment analysis , and 2 of those are a bit concerning...
If you would prefer to check out another company -- one with potentially superior financials -- then do not miss this free list of companies that have proven they can grow earnings.
Please note, the market returns quoted in this article reflect the market weighted average returns of stocks that currently trade on GB exchanges.
Have feedback on this article? Concerned about the content? Get in touch with us directly. Alternatively, email editorial-team (at) simplywallst.com.
This article by Simply Wall St is general in nature. We provide commentary based on historical data and analyst forecasts only using an unbiased methodology and our articles are not intended to be financial advice. It does not constitute a recommendation to buy or sell any stock, and does not take account of your objectives, or your financial situation. We aim to bring you long-term focused analysis driven by fundamental data. Note that our analysis may not factor in the latest price-sensitive company announcements or qualitative material. Simply Wall St has no position in any stocks mentioned.
Join A Paid User Research Session
You’ll receive a US$30 Amazon Gift card for 1 hour of your time while helping us build better investing tools for the individual investors like yourself. Sign up here
