
 Yahoo Finance
 The past three years for GWA Group (ASX:GWA) investors has not been profitable
Many investors define successful investing as beating the market average over the long term. But if you try your hand at stock picking, your risk returning less than the market. We regret to report that long term GWA Group Limited (ASX:GWA) shareholders have had that experience, with the share price dropping 38% in three years, versus a market return of about 28%.
Since shareholders are down over the longer term, lets look at the underlying fundamentals over the that time and see if they've been consistent with returns.
Check out our latest analysis for GWA Group
There is no denying that markets are sometimes efficient, but prices do not always reflect underlying business performance. One way to examine how market sentiment has changed over time is to look at the interaction between a company's share price and its earnings per share (EPS).
GWA Group saw its EPS decline at a compound rate of 0.7% per year, over the last three years. The share price decline of 15% is actually steeper than the EPS slippage. So it seems the market was too confident about the business, in the past. This increased caution is also evident in the rather low P/E ratio, which is sitting at 10.94.
You can see below how EPS has changed over time (discover the exact values by clicking on the image).
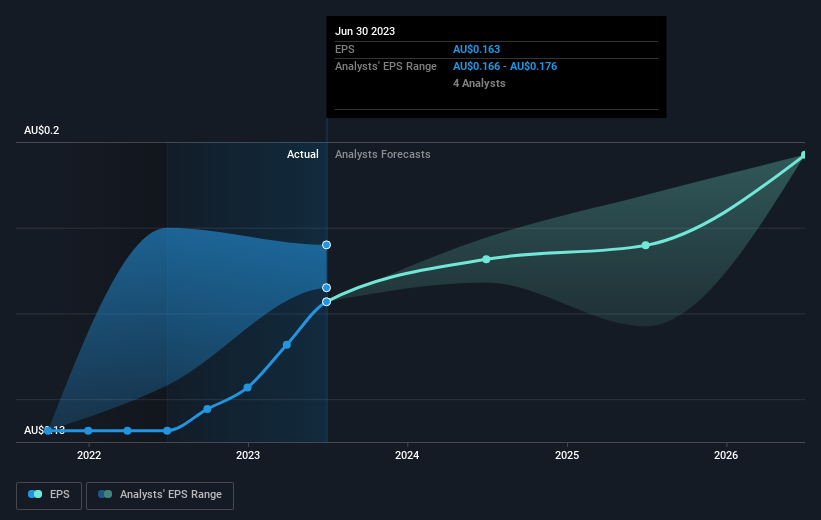
We consider it positive that insiders have made significant purchases in the last year. Having said that, most people consider earnings and revenue growth trends to be a more meaningful guide to the business. Dive deeper into the earnings by checking this interactive graph of GWA Group's earnings, revenue and cash flow.
What About Dividends?
When looking at investment returns, it is important to consider the difference between total shareholder return (TSR) and share price return. The TSR incorporates the value of any spin-offs or discounted capital raisings, along with any dividends, based on the assumption that the dividends are reinvested. It's fair to say that the TSR gives a more complete picture for stocks that pay a dividend. As it happens, GWA Group's TSR for the last 3 years was -26%, which exceeds the share price return mentioned earlier. This is largely a result of its dividend payments!
A Different Perspective
GWA Group shareholders are down 0.7% for the year (even including dividends), but the market itself is up 6.2%. However, keep in mind that even the best stocks will sometimes underperform the market over a twelve month period. Unfortunately, longer term shareholders are suffering worse, given the loss of 3% doled out over the last five years. We would want clear information suggesting the company will grow, before taking the view that the share price will stabilize. While it is well worth considering the different impacts that market conditions can have on the share price, there are other factors that are even more important. To that end, you should be aware of the 1 warning sign we've spotted with GWA Group .
GWA Group is not the only stock that insiders are buying. For those who like to find winning investments this free list of growing companies with recent insider purchasing, could be just the ticket.
Please note, the market returns quoted in this article reflect the market weighted average returns of stocks that currently trade on Australian exchanges.
Have feedback on this article? Concerned about the content? Get in touch with us directly. Alternatively, email editorial-team (at) simplywallst.com.
This article by Simply Wall St is general in nature. We provide commentary based on historical data and analyst forecasts only using an unbiased methodology and our articles are not intended to be financial advice. It does not constitute a recommendation to buy or sell any stock, and does not take account of your objectives, or your financial situation. We aim to bring you long-term focused analysis driven by fundamental data. Note that our analysis may not factor in the latest price-sensitive company announcements or qualitative material. Simply Wall St has no position in any stocks mentioned.
