
 Yahoo Finance
 The past three years for Sabre Insurance Group (LON:SBRE) investors has not been profitable
Sabre Insurance Group plc (LON:SBRE) shareholders should be happy to see the share price up 10% in the last month. But that cannot eclipse the less-than-impressive returns over the last three years. Truth be told the share price declined 46% in three years and that return, Dear Reader, falls short of what you could have got from passive investing with an index fund.
Since shareholders are down over the longer term, lets look at the underlying fundamentals over the that time and see if they've been consistent with returns.
View our latest analysis for Sabre Insurance Group
To paraphrase Benjamin Graham: Over the short term the market is a voting machine, but over the long term it's a weighing machine. One flawed but reasonable way to assess how sentiment around a company has changed is to compare the earnings per share (EPS) with the share price.
Sabre Insurance Group saw its EPS decline at a compound rate of 45% per year, over the last three years. This fall in the EPS is worse than the 19% compound annual share price fall. This suggests that the market retains some optimism around long term earnings stability, despite past EPS declines. This positive sentiment is also reflected in the generous P/E ratio of 52.69.
You can see how EPS has changed over time in the image below (click on the chart to see the exact values).
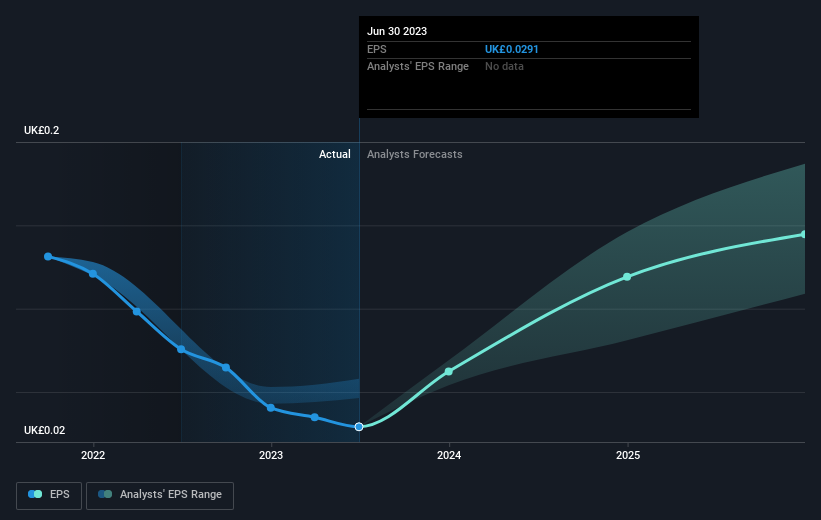
Dive deeper into Sabre Insurance Group's key metrics by checking this interactive graph of Sabre Insurance Group's earnings, revenue and cash flow.
What About Dividends?
When looking at investment returns, it is important to consider the difference between total shareholder return (TSR) and share price return. The TSR incorporates the value of any spin-offs or discounted capital raisings, along with any dividends, based on the assumption that the dividends are reinvested. It's fair to say that the TSR gives a more complete picture for stocks that pay a dividend. In the case of Sabre Insurance Group, it has a TSR of -38% for the last 3 years. That exceeds its share price return that we previously mentioned. The dividends paid by the company have thusly boosted the total shareholder return.
A Different Perspective
We're pleased to report that Sabre Insurance Group shareholders have received a total shareholder return of 46% over one year. And that does include the dividend. That certainly beats the loss of about 5% per year over the last half decade. The long term loss makes us cautious, but the short term TSR gain certainly hints at a brighter future. It's always interesting to track share price performance over the longer term. But to understand Sabre Insurance Group better, we need to consider many other factors. For example, we've discovered 1 warning sign for Sabre Insurance Group that you should be aware of before investing here.
If you are like me, then you will not want to miss this free list of growing companies that insiders are buying.
Please note, the market returns quoted in this article reflect the market weighted average returns of stocks that currently trade on British exchanges.
Have feedback on this article? Concerned about the content? Get in touch with us directly. Alternatively, email editorial-team (at) simplywallst.com.
This article by Simply Wall St is general in nature. We provide commentary based on historical data and analyst forecasts only using an unbiased methodology and our articles are not intended to be financial advice. It does not constitute a recommendation to buy or sell any stock, and does not take account of your objectives, or your financial situation. We aim to bring you long-term focused analysis driven by fundamental data. Note that our analysis may not factor in the latest price-sensitive company announcements or qualitative material. Simply Wall St has no position in any stocks mentioned.
