
 Yahoo Finance
 Patrick Industries (NASDAQ:PATK) sheds 6.8% this week, as yearly returns fall more in line with earnings growth
Stock pickers are generally looking for stocks that will outperform the broader market. And in our experience, buying the right stocks can give your wealth a significant boost. For example, long term Patrick Industries, Inc. (NASDAQ:PATK) shareholders have enjoyed a 97% share price rise over the last half decade, well in excess of the market return of around 69% (not including dividends). However, more recent returns haven't been as impressive as that, with the stock returning just 58% in the last year , including dividends .
In light of the stock dropping 6.8% in the past week, we want to investigate the longer term story, and see if fundamentals have been the driver of the company's positive five-year return.
View our latest analysis for Patrick Industries
In his essay The Superinvestors of Graham-and-Doddsville Warren Buffett described how share prices do not always rationally reflect the value of a business. One way to examine how market sentiment has changed over time is to look at the interaction between a company's share price and its earnings per share (EPS).
Over half a decade, Patrick Industries managed to grow its earnings per share at 5.0% a year. This EPS growth is lower than the 14% average annual increase in the share price. This suggests that market participants hold the company in higher regard, these days. That's not necessarily surprising considering the five-year track record of earnings growth.
You can see how EPS has changed over time in the image below (click on the chart to see the exact values).
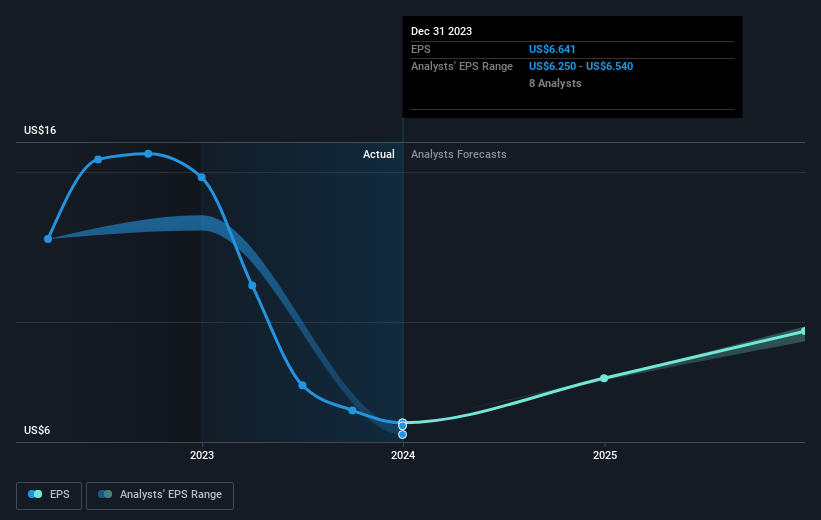
This free interactive report on Patrick Industries' earnings, revenue and cash flow is a great place to start, if you want to investigate the stock further.
What About Dividends?
When looking at investment returns, it is important to consider the difference between total shareholder return (TSR) and share price return. The TSR incorporates the value of any spin-offs or discounted capital raisings, along with any dividends, based on the assumption that the dividends are reinvested. Arguably, the TSR gives a more comprehensive picture of the return generated by a stock. We note that for Patrick Industries the TSR over the last 5 years was 115%, which is better than the share price return mentioned above. This is largely a result of its dividend payments!
A Different Perspective
It's nice to see that Patrick Industries shareholders have received a total shareholder return of 58% over the last year. And that does include the dividend. That's better than the annualised return of 17% over half a decade, implying that the company is doing better recently. Given the share price momentum remains strong, it might be worth taking a closer look at the stock, lest you miss an opportunity. While it is well worth considering the different impacts that market conditions can have on the share price, there are other factors that are even more important. To that end, you should be aware of the 4 warning signs we've spotted with Patrick Industries .
If you are like me, then you will not want to miss this free list of growing companies that insiders are buying.
Please note, the market returns quoted in this article reflect the market weighted average returns of stocks that currently trade on American exchanges.
Have feedback on this article? Concerned about the content? Get in touch with us directly. Alternatively, email editorial-team (at) simplywallst.com.
This article by Simply Wall St is general in nature. We provide commentary based on historical data and analyst forecasts only using an unbiased methodology and our articles are not intended to be financial advice. It does not constitute a recommendation to buy or sell any stock, and does not take account of your objectives, or your financial situation. We aim to bring you long-term focused analysis driven by fundamental data. Note that our analysis may not factor in the latest price-sensitive company announcements or qualitative material. Simply Wall St has no position in any stocks mentioned.
