
 Yahoo Finance
 Paychex (NASDAQ:PAYX) Will Be Hoping To Turn Its Returns On Capital Around
Finding a business that has the potential to grow substantially is not easy, but it is possible if we look at a few key financial metrics. In a perfect world, we'd like to see a company investing more capital into its business and ideally the returns earned from that capital are also increasing. Ultimately, this demonstrates that it's a business that is reinvesting profits at increasing rates of return. So while Paychex (NASDAQ:PAYX) has a high ROCE right now, lets see what we can decipher from how returns are changing.
What Is Return On Capital Employed (ROCE)?
For those that aren't sure what ROCE is, it measures the amount of pre-tax profits a company can generate from the capital employed in its business. Analysts use this formula to calculate it for Paychex:
Return on Capital Employed = Earnings Before Interest and Tax (EBIT) ÷ (Total Assets - Current Liabilities)
0.43 = US$1.9b ÷ (US$9.1b - US$4.7b) (Based on the trailing twelve months to August 2022).
Thus, Paychex has an ROCE of 43%. That's a fantastic return and not only that, it outpaces the average of 12% earned by companies in a similar industry.
See our latest analysis for Paychex
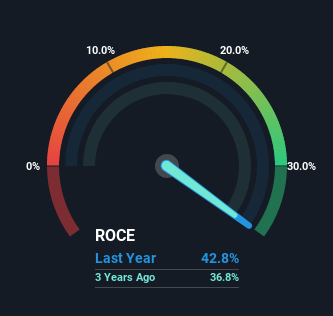
Above you can see how the current ROCE for Paychex compares to its prior returns on capital, but there's only so much you can tell from the past. If you'd like, you can check out the forecasts from the analysts covering Paychex here for free.
The Trend Of ROCE
When we looked at the ROCE trend at Paychex, we didn't gain much confidence. While it's comforting that the ROCE is high, five years ago it was 57%. Although, given both revenue and the amount of assets employed in the business have increased, it could suggest the company is investing in growth, and the extra capital has led to a short-term reduction in ROCE. If these investments prove successful, this can bode very well for long term stock performance.
On a related note, Paychex has decreased its current liabilities to 52% of total assets. So we could link some of this to the decrease in ROCE. Effectively this means their suppliers or short-term creditors are funding less of the business, which reduces some elements of risk. Some would claim this reduces the business' efficiency at generating ROCE since it is now funding more of the operations with its own money. Keep in mind 52% is still pretty high, so those risks are still somewhat prevalent.
What We Can Learn From Paychex's ROCE
Even though returns on capital have fallen in the short term, we find it promising that revenue and capital employed have both increased for Paychex. And long term investors must be optimistic going forward because the stock has returned a huge 110% to shareholders in the last five years. So while the underlying trends could already be accounted for by investors, we still think this stock is worth looking into further.
Paychex does have some risks though, and we've spotted 1 warning sign for Paychex that you might be interested in.
If you want to search for more stocks that have been earning high returns, check out this free list of stocks with solid balance sheets that are also earning high returns on equity.
Have feedback on this article? Concerned about the content? Get in touch with us directly. Alternatively, email editorial-team (at) simplywallst.com.
This article by Simply Wall St is general in nature. We provide commentary based on historical data and analyst forecasts only using an unbiased methodology and our articles are not intended to be financial advice. It does not constitute a recommendation to buy or sell any stock, and does not take account of your objectives, or your financial situation. We aim to bring you long-term focused analysis driven by fundamental data. Note that our analysis may not factor in the latest price-sensitive company announcements or qualitative material. Simply Wall St has no position in any stocks mentioned.
Join A Paid User Research Session
You’ll receive a US$30 Amazon Gift card for 1 hour of your time while helping us build better investing tools for the individual investors like yourself. Sign up here
