
 Yahoo Finance
 PBF Energy's (PBF) Q1 Earnings Beat on Higher Throughput
PBF Energy Inc. PBF reported first-quarter 2024 earnings of 86 cents per share, which beat the Zacks Consensus Estimate of 62 cents. However, the bottom line declined from the year-ago quarter’s figure of $2.76 per share.
Total quarterly revenues declined to $8,646 million from $9,295 million in the prior-year quarter. However, the top line beat the Zacks Consensus Estimate of $8,235 million.
The better-than-expected quarterly earnings can be attributed to higher throughput volumes and lower costs and expenses. This was offset partially by lower margins.
PBF Energy Inc. Price, Consensus and EPS Surprise
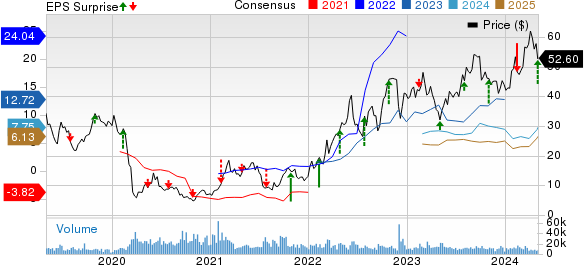
PBF Energy Inc. price-consensus-eps-surprise-chart | PBF Energy Inc. Quote
Segmental Performance
PBF Energy’s operating income from the Refining segment totaled $170.6 million, down from $525.7 million reported a year ago. The figure also lagged our estimate of $221.7 million.
The company generated a profit of $45.1 million from the Logistics segment, indicating a decrease from the prior-year quarter’s level of $49.7 million. Our estimate for the same was pinned at $50.7 million.
Throughput Analysis
Volumes
In the quarter under review, crude oil and feedstock throughput volumes totaled 897.4 thousand barrels per day (bpd), higher than the year-ago figure of 851.2 thousand bpd. The figure also surpassed our estimate of 850.3 bpd.
The East Coast, Mid-Continent, Gulf Coast and West Coast regions accounted for 34%, 13%, 19% and 34%, respectively, of the total oil and feedstock throughput volume.
Margins
The company-wide gross refining margin per barrel of throughput, excluding special items, was $11.73, lower than the year-earlier figure of $18.35.
The gross refining margin per barrel of throughput was $7.72 for the East Coast, down from $18.16 in the year-ago quarter. The realized refining margin was $12.36 per barrel for the Gulf Coast, down from $19.96 a year ago. The metric was $13.15 and $18.15 per barrel in the West Coast and Mid-Continent, respectively, compared with corresponding figures of $20.70 and $9.49 a year ago.
Costs & Expenses
Total costs and expenses in the reported quarter were $8,500.5 million, down from $8,762.6 million in the year-ago period.
Cost of sales, including operating expenses, cost of products and others, and depreciation and amortization expenses, amounted to $8,427.4 million, lower than $8,718.6 million reported a year ago.
Capital Expenditure & Balance Sheet
PBF Energy spent $283.1 million in capital on refining operations. It also spent $1.1 million on logistics businesses.
At the end of the first quarter, it had cash and cash equivalents of $1,441.5 million. As of Mar 31, PBF had a total debt of $1,248.6 million, resulting in a total debt-to-capitalization of 16%.
Outlook
For the second quarter, PBF anticipates total throughput volumes in the range of 870,000-930,000 barrels per day. It expects full-year 2024 refining capital expenditures to be in the band of $800-$850 million.
Zacks Rank and Other Key Picks
Currently, PBF carries a Zacks Rank #2 (Buy).
Investors interested in the energy sector may look at some other top-ranked stocks like SM Energy Company SM, EOG Resources Inc., EOG and Valero Energy Corporation VLO. While SM Energy sports a Zacks Rank #1 (Strong Buy), EOG Resources and Valero Energy carry a Zacks Rank #2 each at present. You can see the complete list of today’s Zacks #1 Rank stocks here.
SM Energy Company is an independent oil and gas company, engaged in the exploration, exploitation, development, acquisition, and production of oil and gas in North America. SM currently has a Value Score of B.
The Zacks Consensus Estimate for SM’s 2024 and 2025 EPS is pegged at $6.33 and $6.96, respectively. The company has witnessed upward earnings estimate revisions for 2024 and 2025 in the past 30 days.
EOG Resources, an oil and gas exploration company, boasts attractive growth prospects, top-tier returns, and a disciplined management team, leveraging highly productive acreages in prime oil shale plays like the Permian and Eagle Ford.
The Zacks Consensus Estimate for EOG’s 2024 EPS is pegged at $12.14. The company has a Zacks Style Score of B for Value and A for Momentum. It has witnessed upward earnings estimate revisions for 2024 in the past 30 days.
Valero Energy is a premier refining player with a presence across North America and the Caribbean. Its diverse network favors robust refining margins, utilizing cost-effective crude for over half of its needs.
The Zacks Consensus Estimate for VLO’s 2024 EPS is pegged at $18.11. The company has a Zacks Style Score of A for Value. It has witnessed upward earnings estimate revisions for 2025 in the past seven days.
Want the latest recommendations from Zacks Investment Research? Today, you can download 7 Best Stocks for the Next 30 Days. Click to get this free report
Valero Energy Corporation (VLO) : Free Stock Analysis Report
EOG Resources, Inc. (EOG) : Free Stock Analysis Report
SM Energy Company (SM) : Free Stock Analysis Report
PBF Energy Inc. (PBF) : Free Stock Analysis Report
