
 Yahoo Finance
 Some Pearson (LON:PSON) Shareholders Are Down 17%

Ideally, your overall portfolio should beat the market average. But every investor is virtually certain to have both over-performing and under-performing stocks. At this point some shareholders may be questioning their investment in Pearson plc (LON:PSON), since the last five years saw the share price fall 17%. The falls have accelerated recently, with the share price down 12% in the last three months. We note that the company has reported results fairly recently; and the market is hardly delighted. You can check out the latest numbers in our company report.
See our latest analysis for Pearson
While markets are a powerful pricing mechanism, share prices reflect investor sentiment, not just underlying business performance. One flawed but reasonable way to assess how sentiment around a company has changed is to compare the earnings per share (EPS) with the share price.
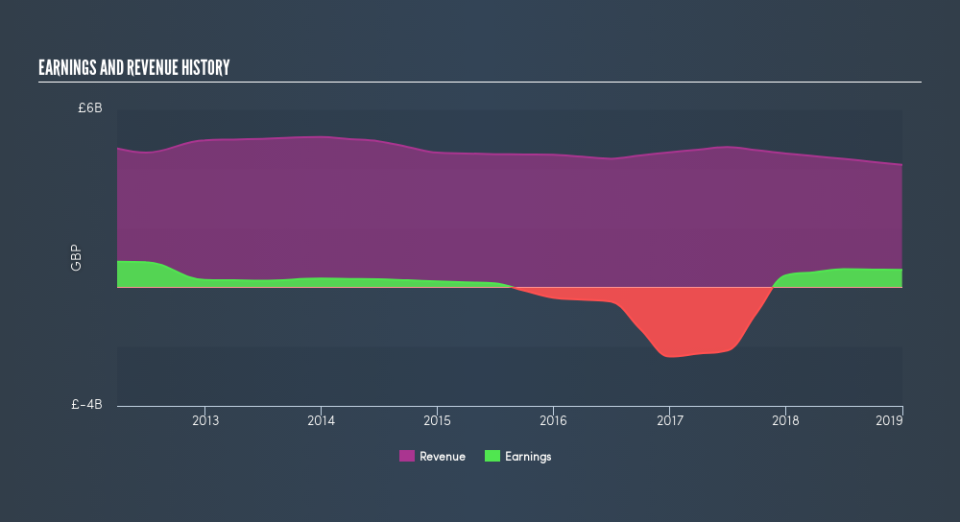
During five years of share price growth, Pearson moved from a loss to profitability. Most would consider that to be a good thing, so it’s counter-intuitive to see the share price declining. Other metrics might give us a better handle on how its value is changing over time.
The revenue fall of 2.4% per year for five years is neither good nor terrible. But if the market expected durable top line growth, then that could explain the share price weakness.
The graphic below shows how revenue and earnings have changed as management guided the business forward. If you want to see cashflow, you can click on the chart.
Pearson is well known by investors, and plenty of clever analysts have tried to predict the future profit levels. Given we have quite a good number of analyst forecasts, it might be well worth checking out this free chart depicting consensus estimates.
What About Dividends?
When looking at investment returns, it is important to consider the difference between total shareholder return (TSR) and share price return. The TSR is a return calculation that accounts for the value of cash dividends (assuming that any dividend received was reinvested) and the calculated value of any discounted capital raisings. Arguably, the TSR gives a more comprehensive picture of the return generated by a stock. We note that for Pearson the TSR over the last 5 years was 4.2%, which is better than the share price return mentioned above. This is largely a result of its dividend payments!
A Different Perspective
We’re pleased to report that Pearson shareholders have received a total shareholder return of 11% over one year. That’s including the dividend. That’s better than the annualised return of 0.8% over half a decade, implying that the company is doing better recently. Someone with an optimistic perspective could view the recent improvement in TSR as indicating that the business itself is getting better with time. Most investors take the time to check the data on insider transactions. You can click here to see if insiders have been buying or selling.
If you would prefer to check out another company — one with potentially superior financials — then do not miss this free list of companies that have proven they can grow earnings.
Please note, the market returns quoted in this article reflect the market weighted average returns of stocks that currently trade on GB exchanges.
We aim to bring you long-term focused research analysis driven by fundamental data. Note that our analysis may not factor in the latest price-sensitive company announcements or qualitative material.
If you spot an error that warrants correction, please contact the editor at editorial-team@simplywallst.com. This article by Simply Wall St is general in nature. It does not constitute a recommendation to buy or sell any stock, and does not take account of your objectives, or your financial situation. Simply Wall St has no position in the stocks mentioned. Thank you for reading.
