
 Yahoo Finance
 Pembina Pipeline Corporation (TSE:PPL) Earns A Nice Return On Capital Employed

Today we'll look at Pembina Pipeline Corporation (TSE:PPL) and reflect on its potential as an investment. In particular, we'll consider its Return On Capital Employed (ROCE), as that can give us insight into how profitably the company is able to employ capital in its business.
First, we'll go over how we calculate ROCE. Then we'll compare its ROCE to similar companies. Last but not least, we'll look at what impact its current liabilities have on its ROCE.
Return On Capital Employed (ROCE): What is it?
ROCE is a measure of a company's yearly pre-tax profit (its return), relative to the capital employed in the business. Generally speaking a higher ROCE is better. Ultimately, it is a useful but imperfect metric. Author Edwin Whiting says to be careful when comparing the ROCE of different businesses, since 'No two businesses are exactly alike.
How Do You Calculate Return On Capital Employed?
Analysts use this formula to calculate return on capital employed:
Return on Capital Employed = Earnings Before Interest and Tax (EBIT) ÷ (Total Assets - Current Liabilities)
Or for Pembina Pipeline:
0.066 = CA$1.8b ÷ (CA$28b - CA$1.5b) (Based on the trailing twelve months to September 2019.)
Therefore, Pembina Pipeline has an ROCE of 6.6%.
Check out our latest analysis for Pembina Pipeline
Is Pembina Pipeline's ROCE Good?
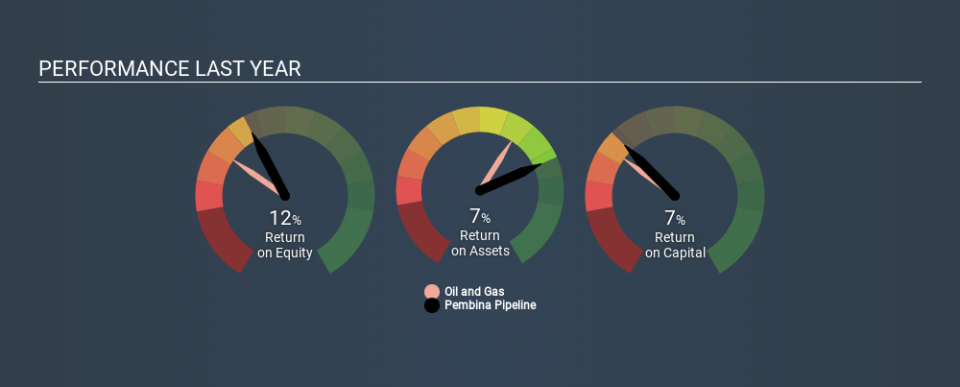
ROCE can be useful when making comparisons, such as between similar companies. In our analysis, Pembina Pipeline's ROCE is meaningfully higher than the 5.3% average in the Oil and Gas industry. We would consider this a positive, as it suggests it is using capital more effectively than other similar companies. Setting aside the industry comparison for now, Pembina Pipeline's ROCE is mediocre in absolute terms, considering the risk of investing in stocks versus the safety of a bank account. It is possible that there are more rewarding investments out there.
The image below shows how Pembina Pipeline's ROCE compares to its industry, and you can click it to see more detail on its past growth.
When considering ROCE, bear in mind that it reflects the past and does not necessarily predict the future. Companies in cyclical industries can be difficult to understand using ROCE, as returns typically look high during boom times, and low during busts. This is because ROCE only looks at one year, instead of considering returns across a whole cycle. Remember that most companies like Pembina Pipeline are cyclical businesses. Future performance is what matters, and you can see analyst predictions in our free report on analyst forecasts for the company.
What Are Current Liabilities, And How Do They Affect Pembina Pipeline's ROCE?
Liabilities, such as supplier bills and bank overdrafts, are referred to as current liabilities if they need to be paid within 12 months. The ROCE equation subtracts current liabilities from capital employed, so a company with a lot of current liabilities appears to have less capital employed, and a higher ROCE than otherwise. To counteract this, we check if a company has high current liabilities, relative to its total assets.
Pembina Pipeline has total assets of CA$28b and current liabilities of CA$1.5b. As a result, its current liabilities are equal to approximately 5.4% of its total assets. Pembina Pipeline reports few current liabilities, which have a negligible impact on its unremarkable ROCE.
The Bottom Line On Pembina Pipeline's ROCE
If performance improves, then Pembina Pipeline may be an OK investment, especially at the right valuation. But note: make sure you look for a great company, not just the first idea you come across. So take a peek at this free list of interesting companies with strong recent earnings growth (and a P/E ratio below 20).
I will like Pembina Pipeline better if I see some big insider buys. While we wait, check out this free list of growing companies with considerable, recent, insider buying.
If you spot an error that warrants correction, please contact the editor at editorial-team@simplywallst.com. This article by Simply Wall St is general in nature. It does not constitute a recommendation to buy or sell any stock, and does not take account of your objectives, or your financial situation. Simply Wall St has no position in the stocks mentioned.
We aim to bring you long-term focused research analysis driven by fundamental data. Note that our analysis may not factor in the latest price-sensitive company announcements or qualitative material. Thank you for reading.
