
 Yahoo Finance
 What Is Pembina Pipeline's (TSE:PPL) P/E Ratio After Its Share Price Tanked?

Unfortunately for some shareholders, the Pembina Pipeline (TSE:PPL) share price has dived 33% in the last thirty days. The recent drop has obliterated the annual return, with the share price now down 28% over that longer period.
All else being equal, a share price drop should make a stock more attractive to potential investors. In the long term, share prices tend to follow earnings per share, but in the short term prices bounce around in response to short term factors (which are not always obvious). The implication here is that long term investors have an opportunity when expectations of a company are too low. One way to gauge market expectations of a stock is to look at its Price to Earnings Ratio (PE Ratio). Investors have optimistic expectations of companies with higher P/E ratios, compared to companies with lower P/E ratios.
Check out our latest analysis for Pembina Pipeline
Does Pembina Pipeline Have A Relatively High Or Low P/E For Its Industry?
We can tell from its P/E ratio of 13.19 that there is some investor optimism about Pembina Pipeline. You can see in the image below that the average P/E (8.2) for companies in the oil and gas industry is lower than Pembina Pipeline's P/E.
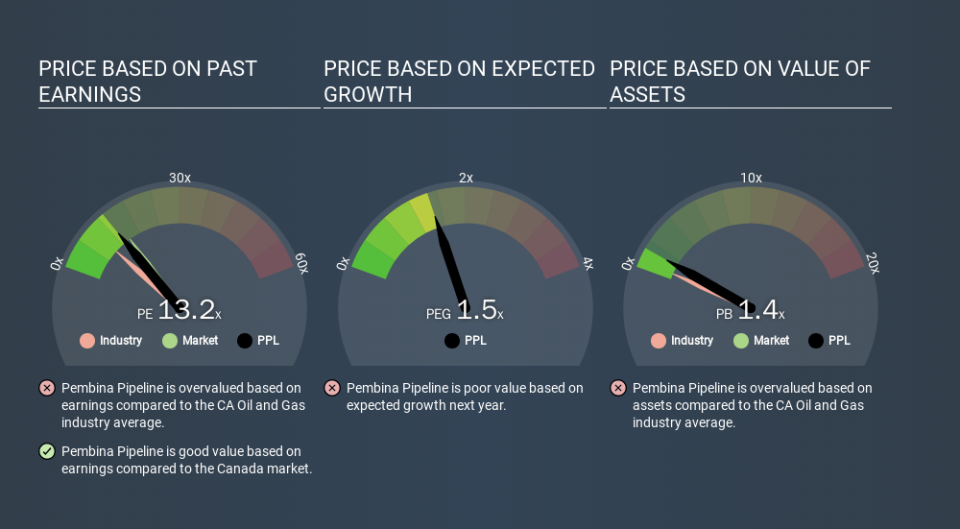
Pembina Pipeline's P/E tells us that market participants think the company will perform better than its industry peers, going forward. Clearly the market expects growth, but it isn't guaranteed. So investors should delve deeper. I like to check if company insiders have been buying or selling.
How Growth Rates Impact P/E Ratios
Generally speaking the rate of earnings growth has a profound impact on a company's P/E multiple. When earnings grow, the 'E' increases, over time. That means even if the current P/E is high, it will reduce over time if the share price stays flat. A lower P/E should indicate the stock is cheap relative to others -- and that may attract buyers.
It's great to see that Pembina Pipeline grew EPS by 16% in the last year. And earnings per share have improved by 20% annually, over the last five years. This could arguably justify a relatively high P/E ratio.
Remember: P/E Ratios Don't Consider The Balance Sheet
Don't forget that the P/E ratio considers market capitalization. That means it doesn't take debt or cash into account. Theoretically, a business can improve its earnings (and produce a lower P/E in the future) by investing in growth. That means taking on debt (or spending its cash).
While growth expenditure doesn't always pay off, the point is that it is a good option to have; but one that the P/E ratio ignores.
Pembina Pipeline's Balance Sheet
Net debt totals 52% of Pembina Pipeline's market cap. If you want to compare its P/E ratio to other companies, you should absolutely keep in mind it has significant borrowings.
The Bottom Line On Pembina Pipeline's P/E Ratio
Pembina Pipeline trades on a P/E ratio of 13.2, which is fairly close to the CA market average of 13.6. While it does have meaningful debt levels, it has also produced strong earnings growth recently. The P/E suggests that the market is not convinced EPS will continue to improve strongly. What can be absolutely certain is that the market has become significantly less optimistic about Pembina Pipeline over the last month, with the P/E ratio falling from 19.7 back then to 13.2 today. For those who don't like to trade against momentum, that could be a warning sign, but a contrarian investor might want to take a closer look.
Investors have an opportunity when market expectations about a stock are wrong. As value investor Benjamin Graham famously said, 'In the short run, the market is a voting machine but in the long run, it is a weighing machine. So this free visualization of the analyst consensus on future earnings could help you make the right decision about whether to buy, sell, or hold.
But note: Pembina Pipeline may not be the best stock to buy. So take a peek at this free list of interesting companies with strong recent earnings growth (and a P/E ratio below 20).
If you spot an error that warrants correction, please contact the editor at editorial-team@simplywallst.com. This article by Simply Wall St is general in nature. It does not constitute a recommendation to buy or sell any stock, and does not take account of your objectives, or your financial situation. Simply Wall St has no position in the stocks mentioned.
We aim to bring you long-term focused research analysis driven by fundamental data. Note that our analysis may not factor in the latest price-sensitive company announcements or qualitative material. Thank you for reading.
