
 Yahoo Finance
 Is Pennon Group Plc's (LON:PNN) ROE Of 14% Impressive?

One of the best investments we can make is in our own knowledge and skill set. With that in mind, this article will work through how we can use Return On Equity (ROE) to better understand a business. We'll use ROE to examine Pennon Group Plc (LON:PNN), by way of a worked example.
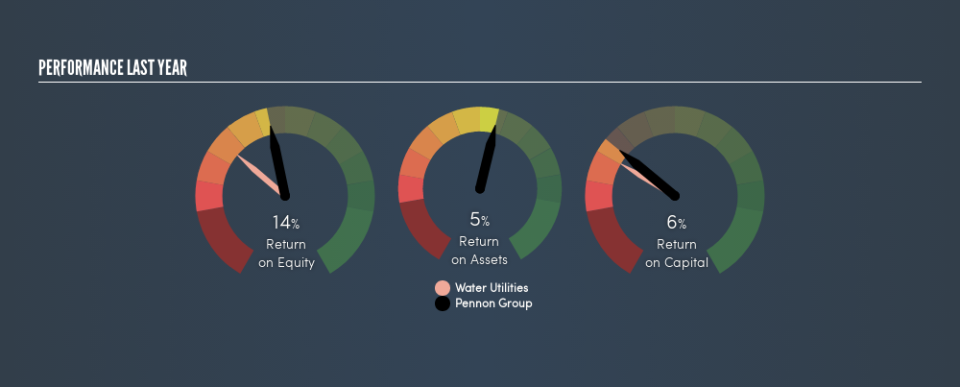
Over the last twelve months Pennon Group has recorded a ROE of 14%. Another way to think of that is that for every £1 worth of equity in the company, it was able to earn £0.14.
Want to participate in a short research study? Help shape the future of investing tools and you could win a $250 gift card!
View our latest analysis for Pennon Group
How Do You Calculate Return On Equity?
The formula for ROE is:
Return on Equity = Net Profit ÷ Shareholders' Equity
Or for Pennon Group:
14% = UK£217m ÷ UK£1.6b (Based on the trailing twelve months to September 2018.)
Most know that net profit is the total earnings after all expenses, but the concept of shareholders' equity is a little more complicated. It is the capital paid in by shareholders, plus any retained earnings. The easiest way to calculate shareholders' equity is to subtract the company's total liabilities from the total assets.
What Does ROE Signify?
ROE looks at the amount a company earns relative to the money it has kept within the business. The 'return' is the yearly profit. The higher the ROE, the more profit the company is making. So, as a general rule, a high ROE is a good thing. That means it can be interesting to compare the ROE of different companies.
Does Pennon Group Have A Good Return On Equity?
Arguably the easiest way to assess company's ROE is to compare it with the average in its industry. Importantly, this is far from a perfect measure, because companies differ significantly within the same industry classification. As is clear from the image below, Pennon Group has a better ROE than the average (8.1%) in the Water Utilities industry.
That is a good sign. I usually take a closer look when a company has a better ROE than industry peers. One data point to check is if insiders have bought shares recently.
How Does Debt Impact Return On Equity?
Companies usually need to invest money to grow their profits. That cash can come from retained earnings, issuing new shares (equity), or debt. In the case of the first and second options, the ROE will reflect this use of cash, for growth. In the latter case, the use of debt will improve the returns, but will not change the equity. Thus the use of debt can improve ROE, albeit along with extra risk in the case of stormy weather, metaphorically speaking.
Pennon Group's Debt And Its 14% ROE
Pennon Group clearly uses a significant amount of debt to boost returns, as it has a debt to equity ratio of 2.17. Its ROE is quite good but, it would have probably been lower without the use of debt. Debt does bring extra risk, so it's only really worthwhile when a company generates some decent returns from it.
In Summary
Return on equity is useful for comparing the quality of different businesses. A company that can achieve a high return on equity without debt could be considered a high quality business. If two companies have the same ROE, then I would generally prefer the one with less debt.
But ROE is just one piece of a bigger puzzle, since high quality businesses often trade on high multiples of earnings. Profit growth rates, versus the expectations reflected in the price of the stock, are a particularly important to consider. So you might want to take a peek at this data-rich interactive graph of forecasts for the company.
Of course, you might find a fantastic investment by looking elsewhere. So take a peek at this free list of interesting companies.
We aim to bring you long-term focused research analysis driven by fundamental data. Note that our analysis may not factor in the latest price-sensitive company announcements or qualitative material.
If you spot an error that warrants correction, please contact the editor at editorial-team@simplywallst.com. This article by Simply Wall St is general in nature. It does not constitute a recommendation to buy or sell any stock, and does not take account of your objectives, or your financial situation. Simply Wall St has no position in the stocks mentioned. Thank you for reading.
