
 Yahoo Finance
 How Do Perenti Global Limited’s (ASX:PRN) Returns On Capital Compare To Peers?

Today we'll look at Perenti Global Limited (ASX:PRN) and reflect on its potential as an investment. In particular, we'll consider its Return On Capital Employed (ROCE), as that can give us insight into how profitably the company is able to employ capital in its business.
First up, we'll look at what ROCE is and how we calculate it. Second, we'll look at its ROCE compared to similar companies. Then we'll determine how its current liabilities are affecting its ROCE.
Return On Capital Employed (ROCE): What is it?
ROCE measures the amount of pre-tax profits a company can generate from the capital employed in its business. In general, businesses with a higher ROCE are usually better quality. In brief, it is a useful tool, but it is not without drawbacks. Renowned investment researcher Michael Mauboussin has suggested that a high ROCE can indicate that 'one dollar invested in the company generates value of more than one dollar'.
So, How Do We Calculate ROCE?
Analysts use this formula to calculate return on capital employed:
Return on Capital Employed = Earnings Before Interest and Tax (EBIT) ÷ (Total Assets - Current Liabilities)
Or for Perenti Global:
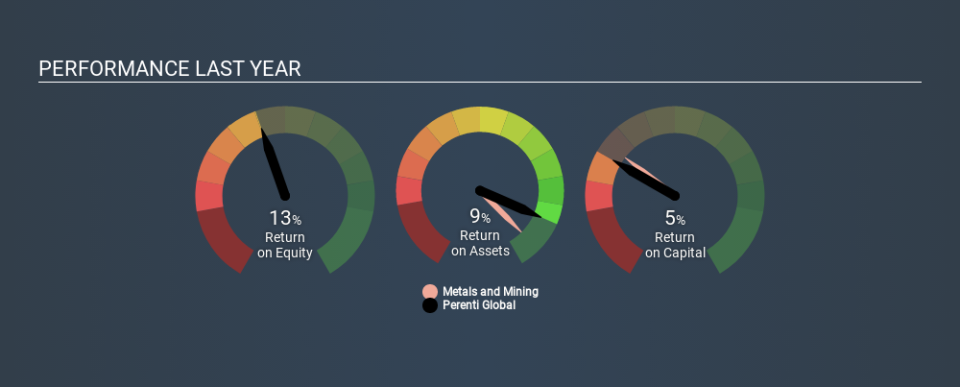
0.048 = AU$110m ÷ (AU$2.7b - AU$378m) (Based on the trailing twelve months to June 2019.)
So, Perenti Global has an ROCE of 4.8%.
Check out our latest analysis for Perenti Global
Does Perenti Global Have A Good ROCE?
ROCE can be useful when making comparisons, such as between similar companies. Using our data, Perenti Global's ROCE appears to be significantly below the 8.0% average in the Metals and Mining industry. This performance could be negative if sustained, as it suggests the business may underperform its industry. Separate from how Perenti Global stacks up against its industry, its ROCE in absolute terms is mediocre; relative to the returns on government bonds. It is possible that there are more rewarding investments out there.
You can click on the image below to see (in greater detail) how Perenti Global's past growth compares to other companies.
When considering this metric, keep in mind that it is backwards looking, and not necessarily predictive. ROCE can be deceptive for cyclical businesses, as returns can look incredible in boom times, and terribly low in downturns. ROCE is only a point-in-time measure. Given the industry it operates in, Perenti Global could be considered cyclical. Future performance is what matters, and you can see analyst predictions in our free report on analyst forecasts for the company.
What Are Current Liabilities, And How Do They Affect Perenti Global's ROCE?
Current liabilities are short term bills and invoices that need to be paid in 12 months or less. Due to the way ROCE is calculated, a high level of current liabilities makes a company look as though it has less capital employed, and thus can (sometimes unfairly) boost the ROCE. To check the impact of this, we calculate if a company has high current liabilities relative to its total assets.
Perenti Global has total liabilities of AU$378m and total assets of AU$2.7b. Therefore its current liabilities are equivalent to approximately 14% of its total assets. This very reasonable level of current liabilities would not boost the ROCE by much.
What We Can Learn From Perenti Global's ROCE
With that in mind, we're not overly impressed with Perenti Global's ROCE, so it may not be the most appealing prospect. Of course, you might find a fantastic investment by looking at a few good candidates. So take a peek at this free list of companies with modest (or no) debt, trading on a P/E below 20.
For those who like to find winning investments this free list of growing companies with recent insider purchasing, could be just the ticket.
If you spot an error that warrants correction, please contact the editor at editorial-team@simplywallst.com. This article by Simply Wall St is general in nature. It does not constitute a recommendation to buy or sell any stock, and does not take account of your objectives, or your financial situation. Simply Wall St has no position in the stocks mentioned.
We aim to bring you long-term focused research analysis driven by fundamental data. Note that our analysis may not factor in the latest price-sensitive company announcements or qualitative material. Thank you for reading.
