
 Yahoo Finance
 Personal Group Holdings Plc (LON:PGH) Stock's Been Sliding But Fundamentals Look Decent: Will The Market Correct The Share Price In The Future?
With its stock down 9.2% over the past three months, it is easy to disregard Personal Group Holdings (LON:PGH). But if you pay close attention, you might find that its key financial indicators look quite decent, which could mean that the stock could potentially rise in the long-term given how markets usually reward more resilient long-term fundamentals. Particularly, we will be paying attention to Personal Group Holdings' ROE today.
Return on Equity or ROE is a test of how effectively a company is growing its value and managing investors’ money. Put another way, it reveals the company's success at turning shareholder investments into profits.
View our latest analysis for Personal Group Holdings
How Is ROE Calculated?
ROE can be calculated by using the formula:
Return on Equity = Net Profit (from continuing operations) ÷ Shareholders' Equity
So, based on the above formula, the ROE for Personal Group Holdings is:
14% = UK£4.3m ÷ UK£32m (Based on the trailing twelve months to December 2023).
The 'return' is the income the business earned over the last year. One way to conceptualize this is that for each £1 of shareholders' capital it has, the company made £0.14 in profit.
Why Is ROE Important For Earnings Growth?
So far, we've learned that ROE is a measure of a company's profitability. We now need to evaluate how much profit the company reinvests or "retains" for future growth which then gives us an idea about the growth potential of the company. Assuming all else is equal, companies that have both a higher return on equity and higher profit retention are usually the ones that have a higher growth rate when compared to companies that don't have the same features.
A Side By Side comparison of Personal Group Holdings' Earnings Growth And 14% ROE
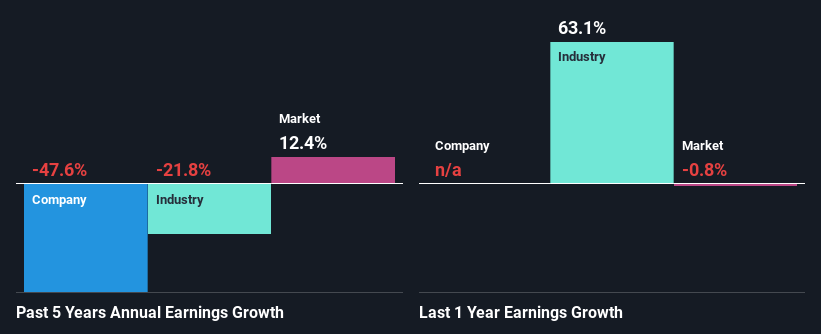
To begin with, Personal Group Holdings seems to have a respectable ROE. Even when compared to the industry average of 13% the company's ROE looks quite decent. However, while Personal Group Holdings has a pretty respectable ROE, its five year net income decline rate was 48% . We reckon that there could be some other factors at play here that are preventing the company's growth. These include low earnings retention or poor allocation of capital.
Furthermore, even when compared to the industry, which has been shrinking its earnings at a rate of 22% over the last few years, we found that Personal Group Holdings' performance is pretty disappointing, as it suggests that the company has been shrunk its earnings at a rate faster than the industry.
The basis for attaching value to a company is, to a great extent, tied to its earnings growth. It’s important for an investor to know whether the market has priced in the company's expected earnings growth (or decline). By doing so, they will have an idea if the stock is headed into clear blue waters or if swampy waters await. One good indicator of expected earnings growth is the P/E ratio which determines the price the market is willing to pay for a stock based on its earnings prospects. So, you may want to check if Personal Group Holdings is trading on a high P/E or a low P/E, relative to its industry.
Is Personal Group Holdings Making Efficient Use Of Its Profits?
With a high three-year median payout ratio of 83% (implying that 17% of the profits are retained), most of Personal Group Holdings' profits are being paid to shareholders, which explains the company's shrinking earnings. With only very little left to reinvest into the business, growth in earnings is far from likely. Our risks dashboard should have the 3 risks we have identified for Personal Group Holdings.
In addition, Personal Group Holdings has been paying dividends over a period of at least ten years suggesting that keeping up dividend payments is way more important to the management even if it comes at the cost of business growth.
Conclusion
In total, it does look like Personal Group Holdings has some positive aspects to its business. However, while the company does have a high ROE, its earnings growth number is quite disappointing. This can be blamed on the fact that it reinvests only a small portion of its profits and pays out the rest as dividends. Until now, we have only just grazed the surface of the company's past performance by looking at the company's fundamentals. You can do your own research on Personal Group Holdings and see how it has performed in the past by looking at this FREE detailed graph of past earnings, revenue and cash flows.
Have feedback on this article? Concerned about the content? Get in touch with us directly. Alternatively, email editorial-team (at) simplywallst.com.
This article by Simply Wall St is general in nature. We provide commentary based on historical data and analyst forecasts only using an unbiased methodology and our articles are not intended to be financial advice. It does not constitute a recommendation to buy or sell any stock, and does not take account of your objectives, or your financial situation. We aim to bring you long-term focused analysis driven by fundamental data. Note that our analysis may not factor in the latest price-sensitive company announcements or qualitative material. Simply Wall St has no position in any stocks mentioned.
