
 Yahoo Finance
 Do You Like Personal Group Holdings Plc (LON:PGH) At This P/E Ratio?

This article is written for those who want to get better at using price to earnings ratios (P/E ratios). We'll show how you can use Personal Group Holdings Plc's (LON:PGH) P/E ratio to inform your assessment of the investment opportunity. Looking at earnings over the last twelve months, Personal Group Holdings has a P/E ratio of 11.80. That is equivalent to an earnings yield of about 8.5%.
View our latest analysis for Personal Group Holdings
How Do You Calculate A P/E Ratio?
The formula for P/E is:
Price to Earnings Ratio = Price per Share ÷ Earnings per Share (EPS)
Or for Personal Group Holdings:
P/E of 11.80 = £3.32 ÷ £0.28 (Based on the year to June 2019.)
Is A High Price-to-Earnings Ratio Good?
The higher the P/E ratio, the higher the price tag of a business, relative to its trailing earnings. That is not a good or a bad thing per se, but a high P/E does imply buyers are optimistic about the future.
Does Personal Group Holdings Have A Relatively High Or Low P/E For Its Industry?
We can get an indication of market expectations by looking at the P/E ratio. If you look at the image below, you can see Personal Group Holdings has a lower P/E than the average (14.1) in the insurance industry classification.
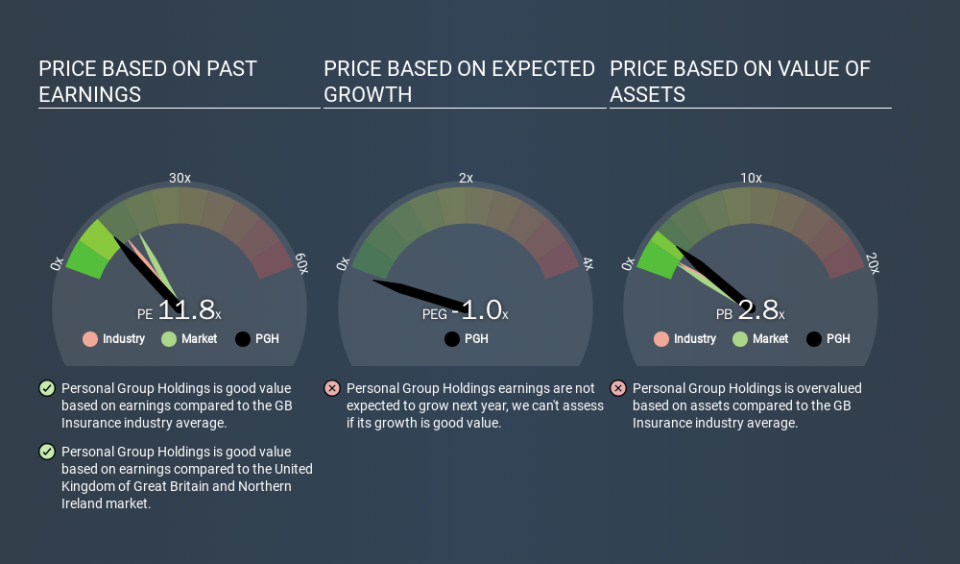
Personal Group Holdings's P/E tells us that market participants think it will not fare as well as its peers in the same industry. Since the market seems unimpressed with Personal Group Holdings, it's quite possible it could surprise on the upside. If you consider the stock interesting, further research is recommended. For example, I often monitor director buying and selling.
How Growth Rates Impact P/E Ratios
When earnings fall, the 'E' decreases, over time. Therefore, even if you pay a low multiple of earnings now, that multiple will become higher in the future. Then, a higher P/E might scare off shareholders, pushing the share price down.
Personal Group Holdings maintained roughly steady earnings over the last twelve months. But it has grown its earnings per share by 31% per year over the last five years. And EPS is down 14% a year, over the last 3 years. So it would be surprising to see a high P/E.
Don't Forget: The P/E Does Not Account For Debt or Bank Deposits
It's important to note that the P/E ratio considers the market capitalization, not the enterprise value. Thus, the metric does not reflect cash or debt held by the company. Theoretically, a business can improve its earnings (and produce a lower P/E in the future) by investing in growth. That means taking on debt (or spending its cash).
While growth expenditure doesn't always pay off, the point is that it is a good option to have; but one that the P/E ratio ignores.
So What Does Personal Group Holdings's Balance Sheet Tell Us?
Personal Group Holdings has net cash of UK£20m. This is fairly high at 19% of its market capitalization. That might mean balance sheet strength is important to the business, but should also help push the P/E a bit higher than it would otherwise be.
The Bottom Line On Personal Group Holdings's P/E Ratio
Personal Group Holdings trades on a P/E ratio of 11.8, which is below the GB market average of 17.8. Falling earnings per share are likely to be keeping potential buyers away, the healthy balance sheet means the company retains potential for future growth. If that occurs, the current low P/E could prove to be temporary.
Investors have an opportunity when market expectations about a stock are wrong. If it is underestimating a company, investors can make money by buying and holding the shares until the market corrects itself. So this free report on the analyst consensus forecasts could help you make a master move on this stock.
Of course, you might find a fantastic investment by looking at a few good candidates. So take a peek at this free list of companies with modest (or no) debt, trading on a P/E below 20.
If you spot an error that warrants correction, please contact the editor at editorial-team@simplywallst.com. This article by Simply Wall St is general in nature. It does not constitute a recommendation to buy or sell any stock, and does not take account of your objectives, or your financial situation. Simply Wall St has no position in the stocks mentioned.
We aim to bring you long-term focused research analysis driven by fundamental data. Note that our analysis may not factor in the latest price-sensitive company announcements or qualitative material. Thank you for reading.