
 Yahoo Finance
 Pets at Home Group Plc’s (LON:PETS) Investment Returns Are Lagging Its Industry

Today we’ll evaluate Pets at Home Group Plc (LON:PETS) to determine whether it could have potential as an investment idea. To be precise, we’ll consider its Return On Capital Employed (ROCE), as that will inform our view of the quality of the business.
Firstly, we’ll go over how we calculate ROCE. Then we’ll compare its ROCE to similar companies. Finally, we’ll look at how its current liabilities affect its ROCE.
What is Return On Capital Employed (ROCE)?
ROCE is a metric for evaluating how much pre-tax income (in percentage terms) a company earns on the capital invested in its business. In general, businesses with a higher ROCE are usually better quality. In brief, it is a useful tool, but it is not without drawbacks. Renowned investment researcher Michael Mauboussin has suggested that a high ROCE can indicate that ‘one dollar invested in the company generates value of more than one dollar’.
So, How Do We Calculate ROCE?
Analysts use this formula to calculate return on capital employed:
Return on Capital Employed = Earnings Before Interest and Tax (EBIT) ÷ (Total Assets – Current Liabilities)
Or for at Home Group:
0.049 = UK£89m ÷ (UK£1.3b – UK£202m) (Based on the trailing twelve months to October 2018.)
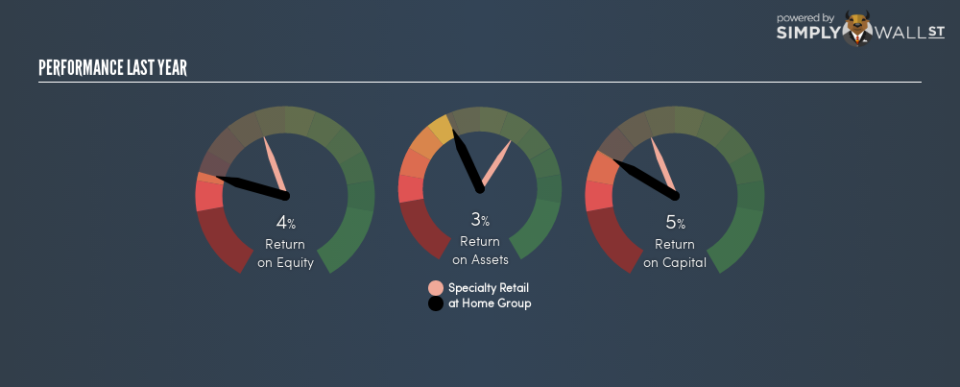
So, at Home Group has an ROCE of 4.9%.
Check out our latest analysis for at Home Group
Want to help shape the future of investing tools and platforms? Take the survey and be part of one of the most advanced studies of stock market investors to date.
Is at Home Group’s ROCE Good?
One way to assess ROCE is to compare similar companies. In this analysis, at Home Group’s ROCE appears meaningfully below the 14% average reported by the Specialty Retail industry. This could be seen as a negative, as it suggests some competitors may be employing their capital more efficiently. Aside from the industry comparison, at Home Group’s ROCE is mediocre in absolute terms, considering the risk of investing in stocks versus the safety of a bank account. Investors may wish to consider higher-performing investments.
As we can see, at Home Group currently has an ROCE of 4.9%, less than the 9.3% it reported 3 years ago. So investors might consider if it has had issues recently.
Remember that this metric is backwards looking – it shows what has happened in the past, and does not accurately predict the future. ROCE can be deceptive for cyclical businesses, as returns can look incredible in boom times, and terribly low in downturns. ROCE is only a point-in-time measure. Future performance is what matters, and you can see analyst predictions in our free report on analyst forecasts for the company.
How at Home Group’s Current Liabilities Impact Its ROCE
Current liabilities include invoices, such as supplier payments, short-term debt, or a tax bill, that need to be paid within 12 months. Due to the way the ROCE equation works, having large bills due in the near term can make it look as though a company has less capital employed, and thus a higher ROCE than usual. To counteract this, we check if a company has high current liabilities, relative to its total assets.
at Home Group has total assets of UK£1.3b and current liabilities of UK£202m. As a result, its current liabilities are equal to approximately 15% of its total assets. This very reasonable level of current liabilities would not boost the ROCE by much.
Our Take On at Home Group’s ROCE
With that in mind, we’re not overly impressed with at Home Group’s ROCE, so it may not be the most appealing prospect. You might be able to find a better buy than at Home Group. If you want a selection of possible winners, check out this free list of interesting companies that trade on a P/E below 20 (but have proven they can grow earnings).
I will like at Home Group better if I see some big insider buys. While we wait, check out this free list of growing companies with considerable, recent, insider buying.
To help readers see past the short term volatility of the financial market, we aim to bring you a long-term focused research analysis purely driven by fundamental data. Note that our analysis does not factor in the latest price-sensitive company announcements.
The author is an independent contributor and at the time of publication had no position in the stocks mentioned. For errors that warrant correction please contact the editor at editorial-team@simplywallst.com.
