
 Yahoo Finance
 Phibro Animal Health (NASDAQ:PAHC) investors are sitting on a loss of 37% if they invested five years ago
While it may not be enough for some shareholders, we think it is good to see the Phibro Animal Health Corporation (NASDAQ:PAHC) share price up 25% in a single quarter. But over the last half decade, the stock has not performed well. After all, the share price is down 45% in that time, significantly under-performing the market.
So let's have a look and see if the longer term performance of the company has been in line with the underlying business' progress.
Check out our latest analysis for Phibro Animal Health
While the efficient markets hypothesis continues to be taught by some, it has been proven that markets are over-reactive dynamic systems, and investors are not always rational. One way to examine how market sentiment has changed over time is to look at the interaction between a company's share price and its earnings per share (EPS).
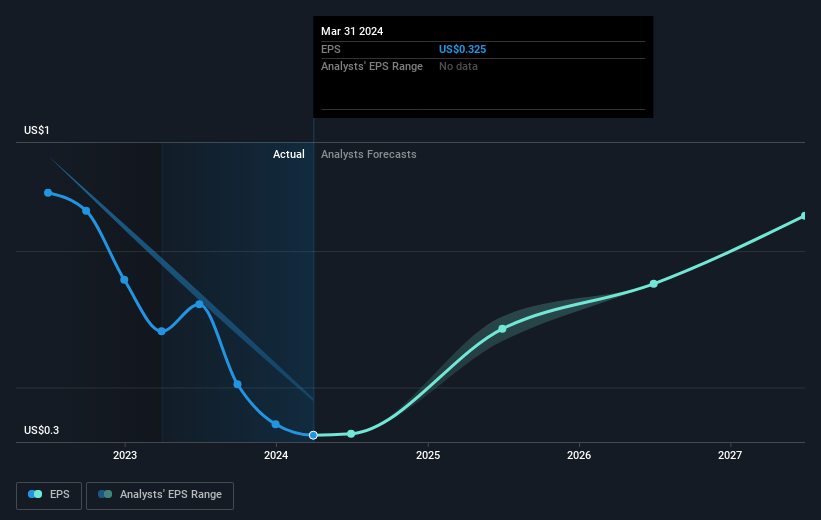
Looking back five years, both Phibro Animal Health's share price and EPS declined; the latter at a rate of 28% per year. The share price decline of 11% per year isn't as bad as the EPS decline. The relatively muted share price reaction might be because the market expects the business to turn around. The high P/E ratio of 50.44 suggests that shareholders believe earnings will grow in the years ahead.
You can see how EPS has changed over time in the image below (click on the chart to see the exact values).
Dive deeper into Phibro Animal Health's key metrics by checking this interactive graph of Phibro Animal Health's earnings, revenue and cash flow.
What About Dividends?
It is important to consider the total shareholder return, as well as the share price return, for any given stock. Whereas the share price return only reflects the change in the share price, the TSR includes the value of dividends (assuming they were reinvested) and the benefit of any discounted capital raising or spin-off. It's fair to say that the TSR gives a more complete picture for stocks that pay a dividend. In the case of Phibro Animal Health, it has a TSR of -37% for the last 5 years. That exceeds its share price return that we previously mentioned. And there's no prize for guessing that the dividend payments largely explain the divergence!
A Different Perspective
Phibro Animal Health shareholders gained a total return of 16% during the year. But that return falls short of the market. On the bright side, that's still a gain, and it is certainly better than the yearly loss of about 7% endured over half a decade. It could well be that the business is stabilizing. It's always interesting to track share price performance over the longer term. But to understand Phibro Animal Health better, we need to consider many other factors. Even so, be aware that Phibro Animal Health is showing 4 warning signs in our investment analysis , and 1 of those is significant...
If you would prefer to check out another company -- one with potentially superior financials -- then do not miss this free list of companies that have proven they can grow earnings.
Please note, the market returns quoted in this article reflect the market weighted average returns of stocks that currently trade on American exchanges.
Have feedback on this article? Concerned about the content? Get in touch with us directly. Alternatively, email editorial-team (at) simplywallst.com.
This article by Simply Wall St is general in nature. We provide commentary based on historical data and analyst forecasts only using an unbiased methodology and our articles are not intended to be financial advice. It does not constitute a recommendation to buy or sell any stock, and does not take account of your objectives, or your financial situation. We aim to bring you long-term focused analysis driven by fundamental data. Note that our analysis may not factor in the latest price-sensitive company announcements or qualitative material. Simply Wall St has no position in any stocks mentioned.
Have feedback on this article? Concerned about the content? Get in touch with us directly. Alternatively, email editorial-team@simplywallst.com
