
 Yahoo Finance
 Phreesia (NYSE:PHR) investors are sitting on a loss of 62% if they invested a year ago
The nature of investing is that you win some, and you lose some. Anyone who held Phreesia, Inc. (NYSE:PHR) over the last year knows what a loser feels like. In that relatively short period, the share price has plunged 62%. However, the longer term returns haven't been so bad, with the stock down 12% in the last three years. Even worse, it's down 12% in about a month, which isn't fun at all. However, we note the price may have been impacted by the broader market, which is down 9.2% in the same time period.
So let's have a look and see if the longer term performance of the company has been in line with the underlying business' progress.
See our latest analysis for Phreesia
Given that Phreesia didn't make a profit in the last twelve months, we'll focus on revenue growth to form a quick view of its business development. Generally speaking, companies without profits are expected to grow revenue every year, and at a good clip. That's because fast revenue growth can be easily extrapolated to forecast profits, often of considerable size.
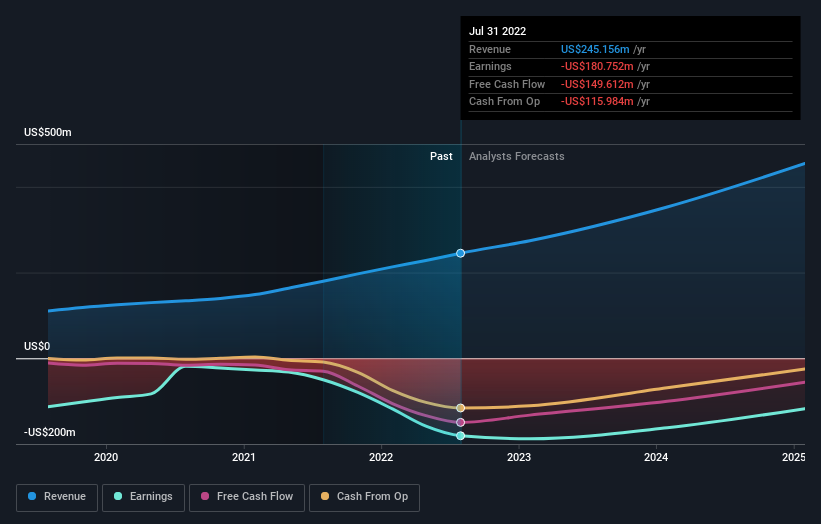
In the last twelve months, Phreesia increased its revenue by 37%. That's definitely a respectable growth rate. Unfortunately it seems investors wanted more, because the share price is down 62% in that time. It may well be that the business remains approximately on track, but its revenue growth has simply been delayed. To our minds it isn't enough to just look at revenue, anyway. Always consider when profits will flow.
You can see below how earnings and revenue have changed over time (discover the exact values by clicking on the image).
Phreesia is well known by investors, and plenty of clever analysts have tried to predict the future profit levels. Given we have quite a good number of analyst forecasts, it might be well worth checking out this free chart depicting consensus estimates.
A Different Perspective
The last twelve months weren't great for Phreesia shares, which performed worse than the market, costing holders 62%. The market shed around 25%, no doubt weighing on the stock price. Shareholders have lost 4% per year over the last three years, so the share price drop has become steeper, over the last year; a potential symptom of as yet unsolved challenges. We would be wary of buying into a company with unsolved problems, although some investors will buy into struggling stocks if they believe the price is sufficiently attractive. It's always interesting to track share price performance over the longer term. But to understand Phreesia better, we need to consider many other factors. Consider risks, for instance. Every company has them, and we've spotted 2 warning signs for Phreesia you should know about.
Of course, you might find a fantastic investment by looking elsewhere. So take a peek at this free list of companies we expect will grow earnings.
Please note, the market returns quoted in this article reflect the market weighted average returns of stocks that currently trade on US exchanges.
Have feedback on this article? Concerned about the content? Get in touch with us directly. Alternatively, email editorial-team (at) simplywallst.com.
This article by Simply Wall St is general in nature. We provide commentary based on historical data and analyst forecasts only using an unbiased methodology and our articles are not intended to be financial advice. It does not constitute a recommendation to buy or sell any stock, and does not take account of your objectives, or your financial situation. We aim to bring you long-term focused analysis driven by fundamental data. Note that our analysis may not factor in the latest price-sensitive company announcements or qualitative material. Simply Wall St has no position in any stocks mentioned.
Join A Paid User Research Session
You’ll receive a US$30 Amazon Gift card for 1 hour of your time while helping us build better investing tools for the individual investors like yourself. Sign up here
