
 Yahoo Finance
 Picton Property Income's (LON:PCTN) investors will be pleased with their favorable 69% return over the last year
The simplest way to invest in stocks is to buy exchange traded funds. But you can significantly boost your returns by picking above-average stocks. To wit, the Picton Property Income Limited (LON:PCTN) share price is 63% higher than it was a year ago, much better than the market return of around 30% (not including dividends) in the same period. That's a solid performance by our standards! However, the stock hasn't done so well in the longer term, with the stock only up 12% in three years.
So let's assess the underlying fundamentals over the last 1 year and see if they've moved in lock-step with shareholder returns.
View our latest analysis for Picton Property Income
While the efficient markets hypothesis continues to be taught by some, it has been proven that markets are over-reactive dynamic systems, and investors are not always rational. One flawed but reasonable way to assess how sentiment around a company has changed is to compare the earnings per share (EPS) with the share price.
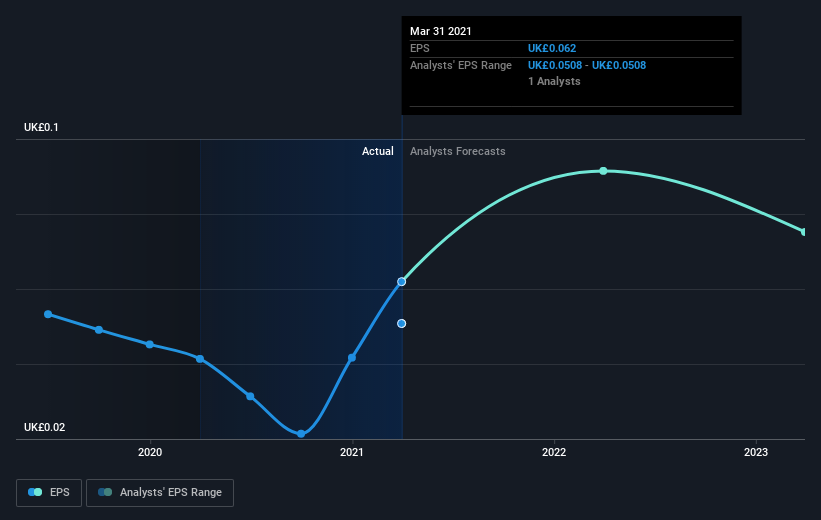
During the last year Picton Property Income grew its earnings per share (EPS) by 50%. The share price gain of 63% certainly outpaced the EPS growth. So it's fair to assume the market has a higher opinion of the business than it a year ago.
You can see how EPS has changed over time in the image below (click on the chart to see the exact values).
We know that Picton Property Income has improved its bottom line lately, but is it going to grow revenue? If you're interested, you could check this free report showing consensus revenue forecasts.
What About Dividends?
When looking at investment returns, it is important to consider the difference between total shareholder return (TSR) and share price return. Whereas the share price return only reflects the change in the share price, the TSR includes the value of dividends (assuming they were reinvested) and the benefit of any discounted capital raising or spin-off. So for companies that pay a generous dividend, the TSR is often a lot higher than the share price return. In the case of Picton Property Income, it has a TSR of 69% for the last 1 year. That exceeds its share price return that we previously mentioned. This is largely a result of its dividend payments!
A Different Perspective
It's good to see that Picton Property Income has rewarded shareholders with a total shareholder return of 69% in the last twelve months. And that does include the dividend. That gain is better than the annual TSR over five years, which is 11%. Therefore it seems like sentiment around the company has been positive lately. In the best case scenario, this may hint at some real business momentum, implying that now could be a great time to delve deeper. I find it very interesting to look at share price over the long term as a proxy for business performance. But to truly gain insight, we need to consider other information, too. To that end, you should be aware of the 2 warning signs we've spotted with Picton Property Income .
Of course, you might find a fantastic investment by looking elsewhere. So take a peek at this free list of companies we expect will grow earnings.
Please note, the market returns quoted in this article reflect the market weighted average returns of stocks that currently trade on GB exchanges.
This article by Simply Wall St is general in nature. We provide commentary based on historical data and analyst forecasts only using an unbiased methodology and our articles are not intended to be financial advice. It does not constitute a recommendation to buy or sell any stock, and does not take account of your objectives, or your financial situation. We aim to bring you long-term focused analysis driven by fundamental data. Note that our analysis may not factor in the latest price-sensitive company announcements or qualitative material. Simply Wall St has no position in any stocks mentioned.
Have feedback on this article? Concerned about the content? Get in touch with us directly. Alternatively, email editorial-team (at) simplywallst.com.
