
 Yahoo Finance
 Is PJSC Gazprom Neft (MCX:SIBN) As Strong As Its Balance Sheet Indicates?

PJSC Gazprom Neft (MCX:SIBN), a large-cap worth RUруб1.55t, comes to mind for investors seeking a strong and reliable stock investment. Most investors favour these big stocks due to their strong balance sheet and high market liquidity, meaning there are an adundance of stock in the public market available for trading. In times of low liquidity in the market, these firms won’t be left high and dry. They are also relatively unaffected by increases in interest rates. Assessing the most recent data for SIBN, I will take you through the key ratios to measure financial health, in particular, its solvency and liquidity.
View our latest analysis for PJSC Gazprom Neft
How much cash does SIBN generate through its operations?
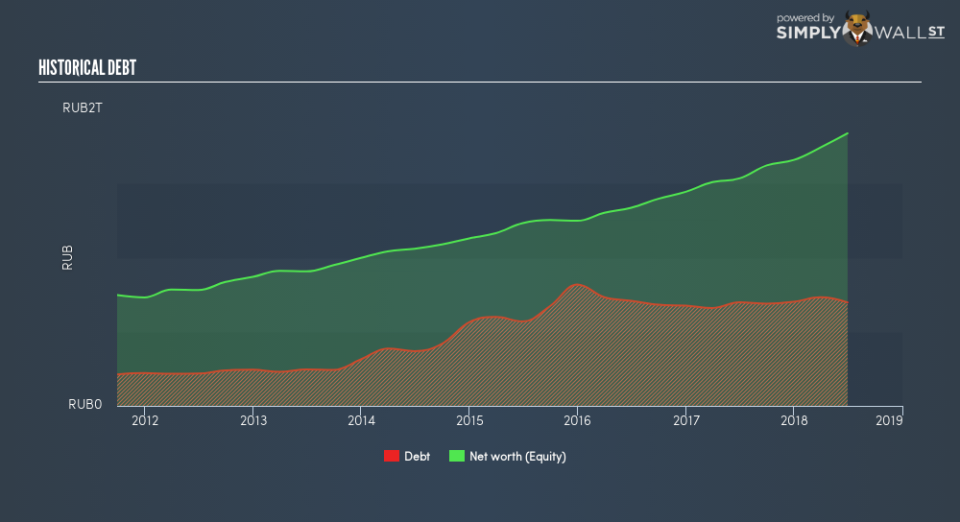
Over the past year, SIBN has maintained its debt levels at around RUруб698.49b made up of current and long term debt. At this current level of debt, SIBN currently has RUруб70.97b remaining in cash and short-term investments , ready to deploy into the business. Moreover, SIBN has generated cash from operations of RUруб450.86b over the same time period, resulting in an operating cash to total debt ratio of 64.5%, signalling that SIBN’s debt is appropriately covered by operating cash. This ratio can also be interpreted as a measure of efficiency as an alternative to return on assets. In SIBN’s case, it is able to generate 0.65x cash from its debt capital.
Can SIBN pay its short-term liabilities?
With current liabilities at RUруб414.11b, the company has been able to meet these commitments with a current assets level of RUруб464.04b, leading to a 1.12x current account ratio. For Oil and Gas companies, this ratio is within a sensible range since there is a bit of a cash buffer without leaving too much capital in a low-return environment.
Does SIBN face the risk of succumbing to its debt-load?
With a debt-to-equity ratio of 38.0%, SIBN’s debt level may be seen as prudent. SIBN is not taking on too much debt commitment, which may be constraining for future growth. We can test if SIBN’s debt levels are sustainable by measuring interest payments against earnings of a company. A company generating earnings after interest and tax at least three times its net interest payments is considered financially sound. For SIBN, the ratio of 27.76x suggests that interest is comfortably covered. It is considered a responsible and reassuring practice to maintain high interest coverage, which makes SIBN and other large-cap investments thought to be safe.
Next Steps:
SIBN’s high cash coverage and appropriate debt levels indicate its ability to utilise its borrowings efficiently in order to generate ample cash flow. Furthermore, the company exhibits an ability to meet its near-term obligations, which isn’t a big surprise for a large-cap. This is only a rough assessment of financial health, and I’m sure SIBN has company-specific issues impacting its capital structure decisions. I suggest you continue to research PJSC Gazprom Neft to get a more holistic view of the stock by looking at:
Future Outlook: What are well-informed industry analysts predicting for SIBN’s future growth? Take a look at our free research report of analyst consensus for SIBN’s outlook.
Valuation: What is SIBN worth today? Is the stock undervalued, even when its growth outlook is factored into its intrinsic value? The intrinsic value infographic in our free research report helps visualize whether SIBN is currently mispriced by the market.
Other High-Performing Stocks: Are there other stocks that provide better prospects with proven track records? Explore our free list of these great stocks here.
To help readers see past the short term volatility of the financial market, we aim to bring you a long-term focused research analysis purely driven by fundamental data. Note that our analysis does not factor in the latest price-sensitive company announcements.
The author is an independent contributor and at the time of publication had no position in the stocks mentioned. For errors that warrant correction please contact the editor at editorial-team@simplywallst.com.
