
 Yahoo Finance
 Plan Optik (ETR:P4O) Is Doing The Right Things To Multiply Its Share Price
If we want to find a stock that could multiply over the long term, what are the underlying trends we should look for? Amongst other things, we'll want to see two things; firstly, a growing return on capital employed (ROCE) and secondly, an expansion in the company's amount of capital employed. If you see this, it typically means it's a company with a great business model and plenty of profitable reinvestment opportunities. So on that note, Plan Optik (ETR:P4O) looks quite promising in regards to its trends of return on capital.
Understanding Return On Capital Employed (ROCE)
For those who don't know, ROCE is a measure of a company's yearly pre-tax profit (its return), relative to the capital employed in the business. To calculate this metric for Plan Optik, this is the formula:
Return on Capital Employed = Earnings Before Interest and Tax (EBIT) ÷ (Total Assets - Current Liabilities)
0.15 = €1.8m ÷ (€16m - €3.4m) (Based on the trailing twelve months to June 2023).
Therefore, Plan Optik has an ROCE of 15%. By itself that's a normal return on capital and it's in line with the industry's average returns of 15%.
View our latest analysis for Plan Optik
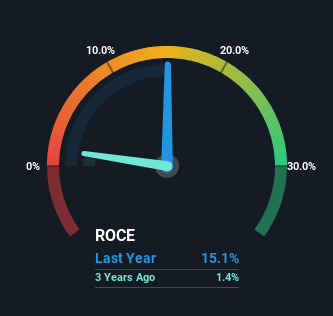
Historical performance is a great place to start when researching a stock so above you can see the gauge for Plan Optik's ROCE against it's prior returns. If you'd like to look at how Plan Optik has performed in the past in other metrics, you can view this free graph of past earnings, revenue and cash flow.
How Are Returns Trending?
The trends we've noticed at Plan Optik are quite reassuring. The numbers show that in the last five years, the returns generated on capital employed have grown considerably to 15%. The amount of capital employed has increased too, by 48%. So we're very much inspired by what we're seeing at Plan Optik thanks to its ability to profitably reinvest capital.
For the record though, there was a noticeable increase in the company's current liabilities over the period, so we would attribute some of the ROCE growth to that. The current liabilities has increased to 22% of total assets, so the business is now more funded by the likes of its suppliers or short-term creditors. It's worth keeping an eye on this because as the percentage of current liabilities to total assets increases, some aspects of risk also increase.
In Conclusion...
In summary, it's great to see that Plan Optik can compound returns by consistently reinvesting capital at increasing rates of return, because these are some of the key ingredients of those highly sought after multi-baggers. And with the stock having performed exceptionally well over the last five years, these patterns are being accounted for by investors. With that being said, we still think the promising fundamentals mean the company deserves some further due diligence.
Plan Optik does have some risks though, and we've spotted 1 warning sign for Plan Optik that you might be interested in.
For those who like to invest in solid companies, check out this free list of companies with solid balance sheets and high returns on equity.
Have feedback on this article? Concerned about the content? Get in touch with us directly. Alternatively, email editorial-team (at) simplywallst.com.
This article by Simply Wall St is general in nature. We provide commentary based on historical data and analyst forecasts only using an unbiased methodology and our articles are not intended to be financial advice. It does not constitute a recommendation to buy or sell any stock, and does not take account of your objectives, or your financial situation. We aim to bring you long-term focused analysis driven by fundamental data. Note that our analysis may not factor in the latest price-sensitive company announcements or qualitative material. Simply Wall St has no position in any stocks mentioned.
