
 Yahoo Finance
 Should You Be Pleased About The CEO Pay At Kindred Group plc's (STO:KIND SDB)

In 2010 Henrik Tjärnström was appointed CEO of Kindred Group plc (STO:KIND SDB). This report will, first, examine the CEO compensation levels in comparison to CEO compensation at companies of similar size. After that, we will consider the growth in the business. And finally we will reflect on how common stockholders have fared in the last few years, as a secondary measure of performance. This process should give us an idea about how appropriately the CEO is paid.
See our latest analysis for Kindred Group
How Does Henrik Tjärnström's Compensation Compare With Similar Sized Companies?
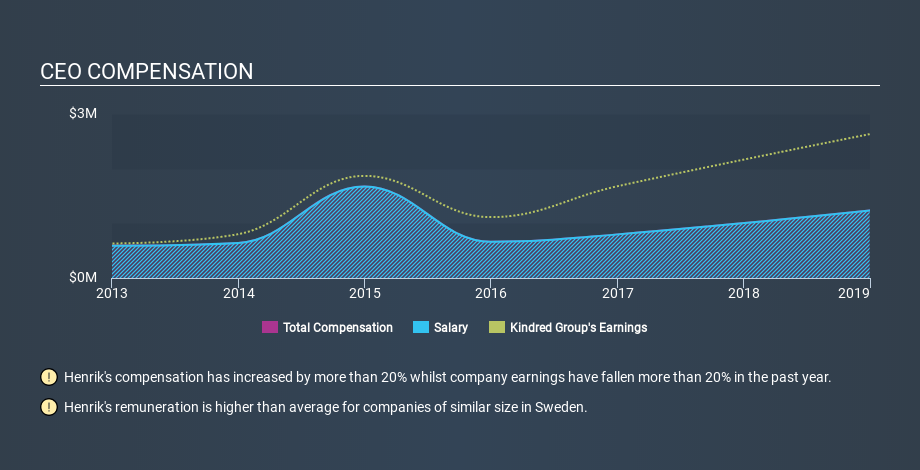
According to our data, Kindred Group plc has a market capitalization of kr13b, and paid its CEO total annual compensation worth UK£1.2m over the year to December 2018. It is worth noting that the CEO compensation consists almost entirely of the salary, worth UK£1.2m. We looked at a group of companies with market capitalizations from UK£759m to UK£2.4b, and the median CEO total compensation was UK£623k.
It would therefore appear that Kindred Group plc pays Henrik Tjärnström more than the median CEO remuneration at companies of a similar size, in the same market. However, this fact alone doesn't mean the remuneration is too high. We can get a better idea of how generous the pay is by looking at the performance of the underlying business.
You can see, below, how CEO compensation at Kindred Group has changed over time.
Is Kindred Group plc Growing?
Over the last three years Kindred Group plc has grown its earnings per share (EPS) by an average of 12% per year (using a line of best fit). Its revenue is up 3.5% over last year.
This shows that the company has improved itself over the last few years. Good news for shareholders. It's nice to see a little revenue growth, as this is consistent with healthy business conditions. Shareholders might be interested in this free visualization of analyst forecasts.
Has Kindred Group plc Been A Good Investment?
With a three year total loss of 12%, Kindred Group plc would certainly have some dissatisfied shareholders. This suggests it would be unwise for the company to pay the CEO too generously.
In Summary...
We compared total CEO remuneration at Kindred Group plc with the amount paid at companies with a similar market capitalization. Our data suggests that it pays above the median CEO pay within that group.
Importantly, though, the company has impressed with its earnings per share growth, over three years. Having said that, shareholders may be disappointed with the weak returns over the last three years. While EPS is positive, we'd say shareholders would want better returns before the CEO is paid much more. Whatever your view on compensation, you might want to check if insiders are buying or selling Kindred Group shares (free trial).
If you want to buy a stock that is better than Kindred Group, this free list of high return, low debt companies is a great place to look.
If you spot an error that warrants correction, please contact the editor at editorial-team@simplywallst.com. This article by Simply Wall St is general in nature. It does not constitute a recommendation to buy or sell any stock, and does not take account of your objectives, or your financial situation. Simply Wall St has no position in the stocks mentioned.
We aim to bring you long-term focused research analysis driven by fundamental data. Note that our analysis may not factor in the latest price-sensitive company announcements or qualitative material. Thank you for reading.
