
 Yahoo Finance
 The Popular (NASDAQ:BPOP) Share Price Is Up 97% And Shareholders Are Holding On

Want to participate in a research study? Help shape the future of investing tools and earn a $60 gift card!
By buying an index fund, you can roughly match the market return with ease. But many of us dare to dream of bigger returns, and build a portfolio ourselves. Just take a look at Popular, Inc. (NASDAQ:BPOP), which is up 97%, over three years, soundly beating the market return of 42% (not including dividends). However, more recent returns haven't been as impressive as that, with the stock returning just 28% in the last year, including dividends.
See our latest analysis for Popular
In his essay The Superinvestors of Graham-and-Doddsville Warren Buffett described how share prices do not always rationally reflect the value of a business. One way to examine how market sentiment has changed over time is to look at the interaction between a company's share price and its earnings per share (EPS).
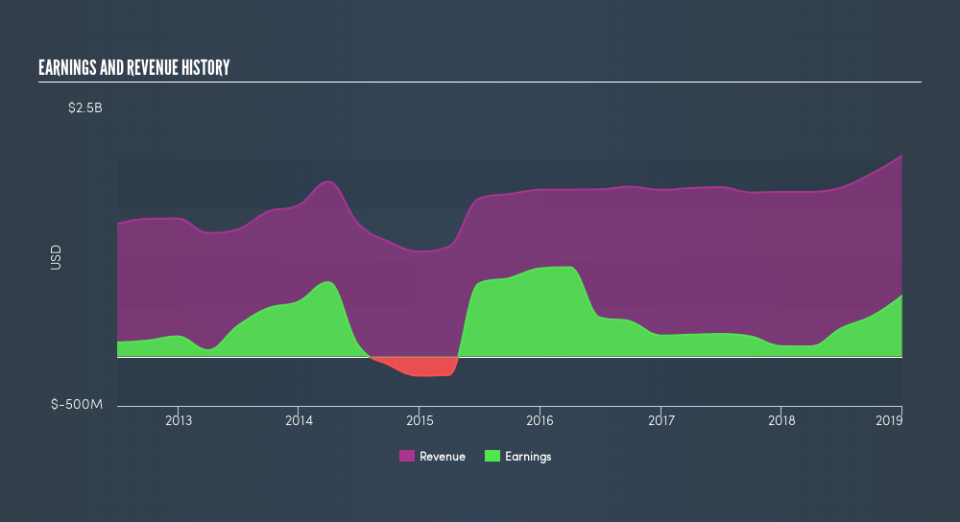
During the three years of share price growth, Popular actually saw its earnings per share (EPS) drop 11% per year. Thus, it seems unlikely that the market is focussed on EPS growth at the moment. Since the change in EPS doesn't seem to correlate with the change in share price, it's worth taking a look at other metrics.
It could be that the revenue growth of 3.4% per year is viewed as evidence that Popular is growing. In that case, the company may be sacrificing current earnings per share to drive growth, and maybe shareholder's faith in better days ahead will be rewarded.
The graphic below shows how revenue and earnings have changed as management guided the business forward. If you want to see cashflow, you can click on the chart.
We know that Popular has improved its bottom line lately, but what does the future have in store? So we recommend checking out this free report showing consensus forecasts
What About Dividends?
As well as measuring the share price return, investors should also consider the total shareholder return (TSR). Whereas the share price return only reflects the change in the share price, the TSR includes the value of dividends (assuming they were reinvested) and the benefit of any discounted capital raising or spin-off. So for companies that pay a generous dividend, the TSR is often a lot higher than the share price return. In the case of Popular, it has a TSR of 110% for the last 3 years. That exceeds its share price return that we previously mentioned. The dividends paid by the company have thusly boosted the total shareholder return.
A Different Perspective
We're pleased to report that Popular shareholders have received a total shareholder return of 28% over one year. Of course, that includes the dividend. That gain is better than the annual TSR over five years, which is 15%. Therefore it seems like sentiment around the company has been positive lately. Given the share price momentum remains strong, it might be worth taking a closer look at the stock, lest you miss an opportunity. Most investors take the time to check the data on insider transactions. You can click here to see if insiders have been buying or selling.
If you like to buy stocks alongside management, then you might just love this free list of companies. (Hint: insiders have been buying them).
Please note, the market returns quoted in this article reflect the market weighted average returns of stocks that currently trade on US exchanges.
We aim to bring you long-term focused research analysis driven by fundamental data. Note that our analysis may not factor in the latest price-sensitive company announcements or qualitative material.
If you spot an error that warrants correction, please contact the editor at editorial-team@simplywallst.com. This article by Simply Wall St is general in nature. It does not constitute a recommendation to buy or sell any stock, and does not take account of your objectives, or your financial situation. Simply Wall St has no position in the stocks mentioned. Thank you for reading.
