
 Yahoo Finance
 Portmeirion Group (LON:PMP) shareholders have earned a 61% return over the last year
It hasn't been the best quarter for Portmeirion Group PLC (LON:PMP) shareholders, since the share price has fallen 10% in that time. But that doesn't change the reality that over twelve months the stock has done really well. Looking at the full year, the company has easily bested an index fund by gaining 61%.
So let's investigate and see if the longer term performance of the company has been in line with the underlying business' progress.
See our latest analysis for Portmeirion Group
There is no denying that markets are sometimes efficient, but prices do not always reflect underlying business performance. One way to examine how market sentiment has changed over time is to look at the interaction between a company's share price and its earnings per share (EPS).
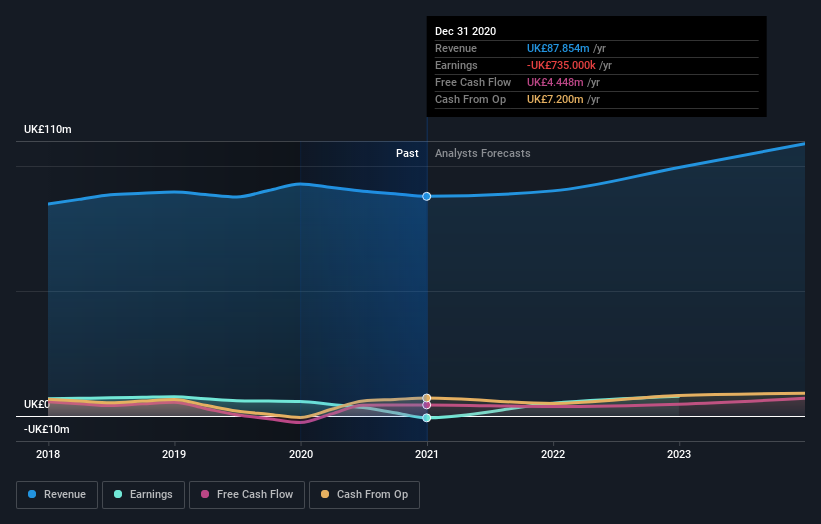
During the last year Portmeirion Group saw its earnings per share (EPS) drop below zero. While some may see this as temporary, we're a skeptical bunch, and so we're a little surprised to see the share price go up. We might get a clue to explain the share price move by looking to other metrics.
Portmeirion Group's revenue actually dropped 5.3% over last year. So using a snapshot of key business metrics doesn't give us a good picture of why the market is bidding up the stock.
You can see below how earnings and revenue have changed over time (discover the exact values by clicking on the image).
This free interactive report on Portmeirion Group's balance sheet strength is a great place to start, if you want to investigate the stock further.
A Different Perspective
It's good to see that Portmeirion Group has rewarded shareholders with a total shareholder return of 61% in the last twelve months. Notably the five-year annualised TSR loss of 4% per year compares very unfavourably with the recent share price performance. This makes us a little wary, but the business might have turned around its fortunes. You could get a better understanding of Portmeirion Group's growth by checking out this more detailed historical graph of earnings, revenue and cash flow.
If you would prefer to check out another company -- one with potentially superior financials -- then do not miss this free list of companies that have proven they can grow earnings.
Please note, the market returns quoted in this article reflect the market weighted average returns of stocks that currently trade on GB exchanges.
This article by Simply Wall St is general in nature. We provide commentary based on historical data and analyst forecasts only using an unbiased methodology and our articles are not intended to be financial advice. It does not constitute a recommendation to buy or sell any stock, and does not take account of your objectives, or your financial situation. We aim to bring you long-term focused analysis driven by fundamental data. Note that our analysis may not factor in the latest price-sensitive company announcements or qualitative material. Simply Wall St has no position in any stocks mentioned.
Have feedback on this article? Concerned about the content? Get in touch with us directly. Alternatively, email editorial-team (at) simplywallst.com.
