
 Yahoo Finance
 PostNL (AMS:PNL) investors are sitting on a loss of 32% if they invested five years ago
Ideally, your overall portfolio should beat the market average. But every investor is virtually certain to have both over-performing and under-performing stocks. At this point some shareholders may be questioning their investment in PostNL N.V. (AMS:PNL), since the last five years saw the share price fall 57%. And some of the more recent buyers are probably worried, too, with the stock falling 50% in the last year.
Since shareholders are down over the longer term, lets look at the underlying fundamentals over the that time and see if they've been consistent with returns.
Check out our latest analysis for PostNL
In his essay The Superinvestors of Graham-and-Doddsville Warren Buffett described how share prices do not always rationally reflect the value of a business. One way to examine how market sentiment has changed over time is to look at the interaction between a company's share price and its earnings per share (EPS).
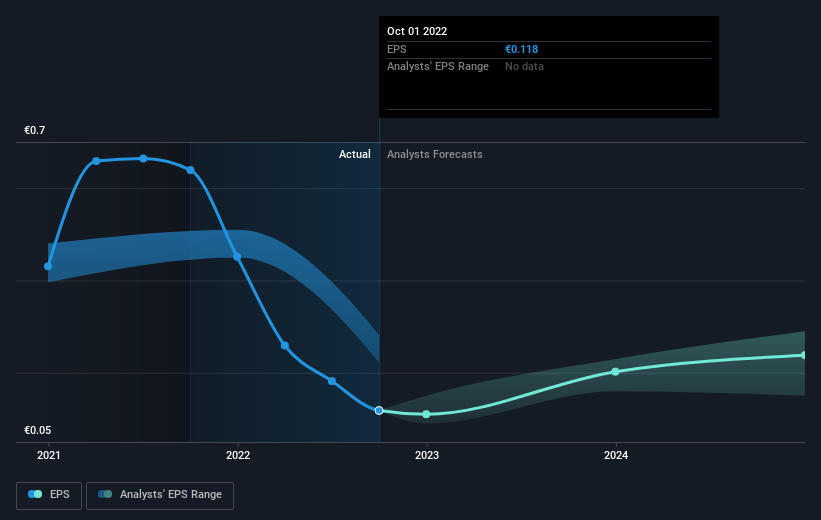
During the five years over which the share price declined, PostNL's earnings per share (EPS) dropped by 22% each year. The share price decline of 15% per year isn't as bad as the EPS decline. The relatively muted share price reaction might be because the market expects the business to turn around.
The image below shows how EPS has tracked over time (if you click on the image you can see greater detail).
Before buying or selling a stock, we always recommend a close examination of historic growth trends, available here.
What About Dividends?
When looking at investment returns, it is important to consider the difference between total shareholder return (TSR) and share price return. The TSR is a return calculation that accounts for the value of cash dividends (assuming that any dividend received was reinvested) and the calculated value of any discounted capital raisings and spin-offs. Arguably, the TSR gives a more comprehensive picture of the return generated by a stock. In the case of PostNL, it has a TSR of -32% for the last 5 years. That exceeds its share price return that we previously mentioned. This is largely a result of its dividend payments!
A Different Perspective
While the broader market lost about 13% in the twelve months, PostNL shareholders did even worse, losing 42% (even including dividends). Having said that, it's inevitable that some stocks will be oversold in a falling market. The key is to keep your eyes on the fundamental developments. Regrettably, last year's performance caps off a bad run, with the shareholders facing a total loss of 6% per year over five years. Generally speaking long term share price weakness can be a bad sign, though contrarian investors might want to research the stock in hope of a turnaround. While it is well worth considering the different impacts that market conditions can have on the share price, there are other factors that are even more important. For instance, we've identified 5 warning signs for PostNL (1 can't be ignored) that you should be aware of.
We will like PostNL better if we see some big insider buys. While we wait, check out this free list of growing companies with considerable, recent, insider buying.
Please note, the market returns quoted in this article reflect the market weighted average returns of stocks that currently trade on NL exchanges.
Have feedback on this article? Concerned about the content? Get in touch with us directly. Alternatively, email editorial-team (at) simplywallst.com.
This article by Simply Wall St is general in nature. We provide commentary based on historical data and analyst forecasts only using an unbiased methodology and our articles are not intended to be financial advice. It does not constitute a recommendation to buy or sell any stock, and does not take account of your objectives, or your financial situation. We aim to bring you long-term focused analysis driven by fundamental data. Note that our analysis may not factor in the latest price-sensitive company announcements or qualitative material. Simply Wall St has no position in any stocks mentioned.
Join A Paid User Research Session
You’ll receive a US$30 Amazon Gift card for 1 hour of your time while helping us build better investing tools for the individual investors like yourself. Sign up here
