
 Yahoo Finance
 Is Prada S.p.A.'s (HKG:1913) 8.8% ROE Better Than Average?

One of the best investments we can make is in our own knowledge and skill set. With that in mind, this article will work through how we can use Return On Equity (ROE) to better understand a business. By way of learning-by-doing, we'll look at ROE to gain a better understanding of Prada S.p.A. (HKG:1913).
Over the last twelve months Prada has recorded a ROE of 8.8%. That means that for every HK$1 worth of shareholders' equity, it generated HK$0.09 in profit.
View our latest analysis for Prada
How Do You Calculate Return On Equity?
The formula for ROE is:
Return on Equity = Net Profit ÷ Shareholders' Equity
Or for Prada:
8.8% = €255m ÷ €2.9b (Based on the trailing twelve months to June 2019.)
Most know that net profit is the total earnings after all expenses, but the concept of shareholders' equity is a little more complicated. It is all the money paid into the company from shareholders, plus any earnings retained. You can calculate shareholders' equity by subtracting the company's total liabilities from its total assets.
What Does ROE Mean?
ROE measures a company's profitability against the profit it retains, and any outside investments. The 'return' is the profit over the last twelve months. That means that the higher the ROE, the more profitable the company is. So, all else being equal, a high ROE is better than a low one. That means ROE can be used to compare two businesses.
Does Prada Have A Good Return On Equity?
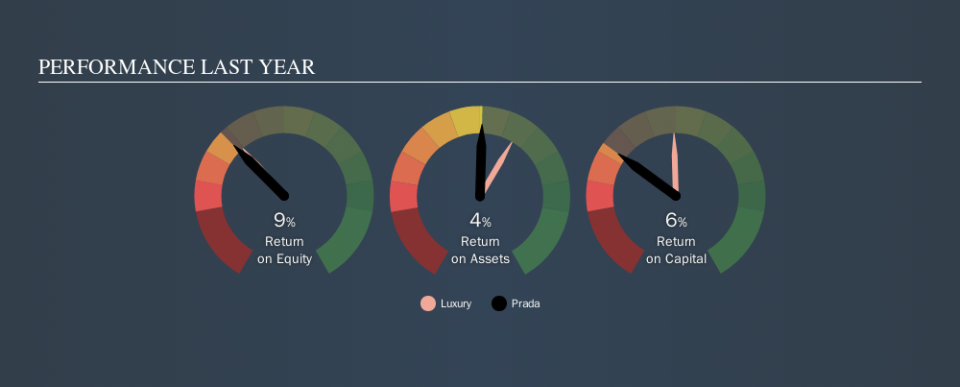
One simple way to determine if a company has a good return on equity is to compare it to the average for its industry. Importantly, this is far from a perfect measure, because companies differ significantly within the same industry classification. The image below shows that Prada has an ROE that is roughly in line with the Luxury industry average (9.4%).
That's not overly surprising. ROE tells us about the quality of the business, but it does not give us much of an idea if the share price is cheap. If you like to buy stocks alongside management, then you might just love this free list of companies. (Hint: insiders have been buying them).
How Does Debt Impact ROE?
Most companies need money -- from somewhere -- to grow their profits. That cash can come from issuing shares, retained earnings, or debt. In the first two cases, the ROE will capture this use of capital to grow. In the latter case, the use of debt will improve the returns, but will not change the equity. Thus the use of debt can improve ROE, albeit along with extra risk in the case of stormy weather, metaphorically speaking.
Prada's Debt And Its 8.8% ROE
Although Prada does use debt, its debt to equity ratio of 0.29 is still low. Although the ROE isn't overly impressive, the debt load is modest, suggesting the business has potential. Conservative use of debt to boost returns is usually a good move for shareholders, though it does leave the company more exposed to interest rate rises.
The Bottom Line On ROE
Return on equity is a useful indicator of the ability of a business to generate profits and return them to shareholders. In my book the highest quality companies have high return on equity, despite low debt. All else being equal, a higher ROE is better.
But ROE is just one piece of a bigger puzzle, since high quality businesses often trade on high multiples of earnings. The rate at which profits are likely to grow, relative to the expectations of profit growth reflected in the current price, must be considered, too. So you might want to take a peek at this data-rich interactive graph of forecasts for the company.
Of course, you might find a fantastic investment by looking elsewhere. So take a peek at this free list of interesting companies.
We aim to bring you long-term focused research analysis driven by fundamental data. Note that our analysis may not factor in the latest price-sensitive company announcements or qualitative material.
If you spot an error that warrants correction, please contact the editor at editorial-team@simplywallst.com. This article by Simply Wall St is general in nature. It does not constitute a recommendation to buy or sell any stock, and does not take account of your objectives, or your financial situation. Simply Wall St has no position in the stocks mentioned. Thank you for reading.
