
 Yahoo Finance
 Praemium Limited's (ASX:PPS) Fundamentals Look Pretty Strong: Could The Market Be Wrong About The Stock?
With its stock down 7.1% over the past three months, it is easy to disregard Praemium (ASX:PPS). However, the company's fundamentals look pretty decent, and long-term financials are usually aligned with future market price movements. Specifically, we decided to study Praemium's ROE in this article.
Return on equity or ROE is a key measure used to assess how efficiently a company's management is utilizing the company's capital. Put another way, it reveals the company's success at turning shareholder investments into profits.
View our latest analysis for Praemium
How Is ROE Calculated?
ROE can be calculated by using the formula:
Return on Equity = Net Profit (from continuing operations) ÷ Shareholders' Equity
So, based on the above formula, the ROE for Praemium is:
9.5% = AU$10m ÷ AU$106m (Based on the trailing twelve months to December 2023).
The 'return' refers to a company's earnings over the last year. So, this means that for every A$1 of its shareholder's investments, the company generates a profit of A$0.10.
What Is The Relationship Between ROE And Earnings Growth?
We have already established that ROE serves as an efficient profit-generating gauge for a company's future earnings. Based on how much of its profits the company chooses to reinvest or "retain", we are then able to evaluate a company's future ability to generate profits. Assuming everything else remains unchanged, the higher the ROE and profit retention, the higher the growth rate of a company compared to companies that don't necessarily bear these characteristics.
Praemium's Earnings Growth And 9.5% ROE
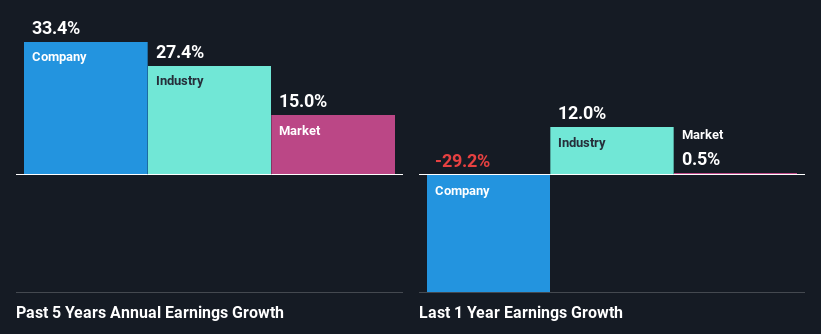
When you first look at it, Praemium's ROE doesn't look that attractive. However, given that the company's ROE is similar to the average industry ROE of 10%, we may spare it some thought. Moreover, we are quite pleased to see that Praemium's net income grew significantly at a rate of 33% over the last five years. Given the slightly low ROE, it is likely that there could be some other aspects that are driving this growth. For instance, the company has a low payout ratio or is being managed efficiently.
We then compared Praemium's net income growth with the industry and we're pleased to see that the company's growth figure is higher when compared with the industry which has a growth rate of 27% in the same 5-year period.
Earnings growth is an important metric to consider when valuing a stock. The investor should try to establish if the expected growth or decline in earnings, whichever the case may be, is priced in. Doing so will help them establish if the stock's future looks promising or ominous. If you're wondering about Praemium's's valuation, check out this gauge of its price-to-earnings ratio, as compared to its industry.
Is Praemium Using Its Retained Earnings Effectively?
Given that Praemium doesn't pay any dividend to its shareholders, we infer that the company has been reinvesting all of its profits to grow its business.
Summary
Overall, we feel that Praemium certainly does have some positive factors to consider. With a high rate of reinvestment, albeit at a low ROE, the company has managed to see a considerable growth in its earnings. Having said that, the company's earnings growth is expected to slow down, as forecasted in the current analyst estimates. To know more about the latest analysts predictions for the company, check out this visualization of analyst forecasts for the company.
Have feedback on this article? Concerned about the content? Get in touch with us directly. Alternatively, email editorial-team (at) simplywallst.com.
This article by Simply Wall St is general in nature. We provide commentary based on historical data and analyst forecasts only using an unbiased methodology and our articles are not intended to be financial advice. It does not constitute a recommendation to buy or sell any stock, and does not take account of your objectives, or your financial situation. We aim to bring you long-term focused analysis driven by fundamental data. Note that our analysis may not factor in the latest price-sensitive company announcements or qualitative material. Simply Wall St has no position in any stocks mentioned.
