
 Yahoo Finance
 The Price Is Right For CMO Group PLC (LON:CMO)
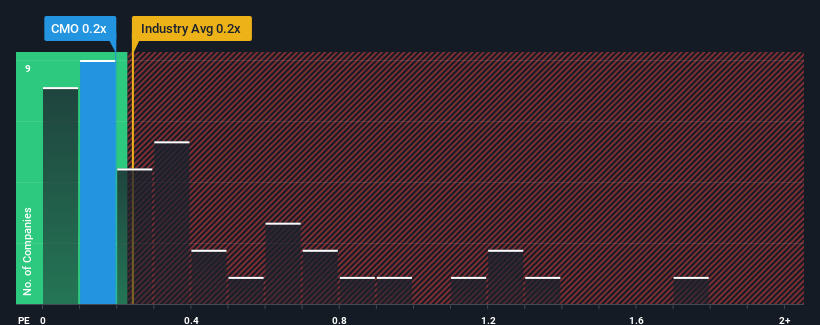
It's not a stretch to say that CMO Group PLC's (LON:CMO) price-to-sales (or "P/S") ratio of 0.2x seems quite "middle-of-the-road" for Specialty Retail companies in the United Kingdom, seeing as it matches the P/S ratio of the wider industry. However, investors might be overlooking a clear opportunity or potential setback if there is no rational basis for the P/S.
View our latest analysis for CMO Group
What Does CMO Group's Recent Performance Look Like?
CMO Group could be doing better as it's been growing revenue less than most other companies lately. Perhaps the market is expecting future revenue performance to lift, which has kept the P/S from declining. You'd really hope so, otherwise you're paying a relatively elevated price for a company with this sort of growth profile.
Want the full picture on analyst estimates for the company? Then our free report on CMO Group will help you uncover what's on the horizon.
Do Revenue Forecasts Match The P/S Ratio?
In order to justify its P/S ratio, CMO Group would need to produce growth that's similar to the industry.
Taking a look back first, we see that the company managed to grow revenues by a handy 8.8% last year. Pleasingly, revenue has also lifted 85% in aggregate from three years ago, partly thanks to the last 12 months of growth. Accordingly, shareholders would have definitely welcomed those medium-term rates of revenue growth.
Shifting to the future, estimates from the lone analyst covering the company suggest revenue should grow by 7.2% per year over the next three years. With the industry predicted to deliver 6.3% growth per year, the company is positioned for a comparable revenue result.
In light of this, it's understandable that CMO Group's P/S sits in line with the majority of other companies. It seems most investors are expecting to see average future growth and are only willing to pay a moderate amount for the stock.
The Key Takeaway
While the price-to-sales ratio shouldn't be the defining factor in whether you buy a stock or not, it's quite a capable barometer of revenue expectations.
Our look at CMO Group's revenue growth estimates show that its P/S is about what we expect, as both metrics follow closely with the industry averages. Right now shareholders are comfortable with the P/S as they are quite confident future revenue won't throw up any surprises. All things considered, if the P/S and revenue estimates contain no major shocks, then it's hard to see the share price moving strongly in either direction in the near future.
Plus, you should also learn about this 1 warning sign we've spotted with CMO Group.
Of course, profitable companies with a history of great earnings growth are generally safer bets. So you may wish to see this free collection of other companies that have reasonable P/E ratios and have grown earnings strongly.
Have feedback on this article? Concerned about the content? Get in touch with us directly. Alternatively, email editorial-team (at) simplywallst.com.
This article by Simply Wall St is general in nature. We provide commentary based on historical data and analyst forecasts only using an unbiased methodology and our articles are not intended to be financial advice. It does not constitute a recommendation to buy or sell any stock, and does not take account of your objectives, or your financial situation. We aim to bring you long-term focused analysis driven by fundamental data. Note that our analysis may not factor in the latest price-sensitive company announcements or qualitative material. Simply Wall St has no position in any stocks mentioned.
Join A Paid User Research Session
You’ll receive a US$30 Amazon Gift card for 1 hour of your time while helping us build better investing tools for the individual investors like yourself. Sign up here
