
 Yahoo Finance
 PRL Global (ASX:PRG) Is Looking To Continue Growing Its Returns On Capital
If we want to find a stock that could multiply over the long term, what are the underlying trends we should look for? Firstly, we'll want to see a proven return on capital employed (ROCE) that is increasing, and secondly, an expanding base of capital employed. Ultimately, this demonstrates that it's a business that is reinvesting profits at increasing rates of return. So on that note, PRL Global (ASX:PRG) looks quite promising in regards to its trends of return on capital.
Return On Capital Employed (ROCE): What Is It?
For those that aren't sure what ROCE is, it measures the amount of pre-tax profits a company can generate from the capital employed in its business. To calculate this metric for PRL Global, this is the formula:
Return on Capital Employed = Earnings Before Interest and Tax (EBIT) ÷ (Total Assets - Current Liabilities)
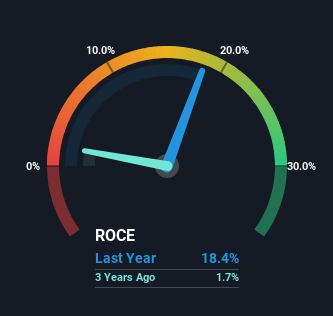
0.18 = AU$51m ÷ (AU$469m - AU$191m) (Based on the trailing twelve months to June 2023).
Thus, PRL Global has an ROCE of 18%. On its own, that's a standard return, however it's much better than the 9.0% generated by the Metals and Mining industry.
Check out our latest analysis for PRL Global
While the past is not representative of the future, it can be helpful to know how a company has performed historically, which is why we have this chart above. If you want to delve into the historical earnings, revenue and cash flow of PRL Global, check out these free graphs here.
What Can We Tell From PRL Global's ROCE Trend?
We like the trends that we're seeing from PRL Global. The numbers show that in the last five years, the returns generated on capital employed have grown considerably to 18%. The amount of capital employed has increased too, by 24%. This can indicate that there's plenty of opportunities to invest capital internally and at ever higher rates, a combination that's common among multi-baggers.
On a side note, we noticed that the improvement in ROCE appears to be partly fueled by an increase in current liabilities. Effectively this means that suppliers or short-term creditors are now funding 41% of the business, which is more than it was five years ago. And with current liabilities at those levels, that's pretty high.
The Key Takeaway
All in all, it's terrific to see that PRL Global is reaping the rewards from prior investments and is growing its capital base. Since the stock has only returned 24% to shareholders over the last five years, the promising fundamentals may not be recognized yet by investors. Given that, we'd look further into this stock in case it has more traits that could make it multiply in the long term.
One more thing, we've spotted 2 warning signs facing PRL Global that you might find interesting.
While PRL Global may not currently earn the highest returns, we've compiled a list of companies that currently earn more than 25% return on equity. Check out this free list here.
Have feedback on this article? Concerned about the content? Get in touch with us directly. Alternatively, email editorial-team (at) simplywallst.com.
This article by Simply Wall St is general in nature. We provide commentary based on historical data and analyst forecasts only using an unbiased methodology and our articles are not intended to be financial advice. It does not constitute a recommendation to buy or sell any stock, and does not take account of your objectives, or your financial situation. We aim to bring you long-term focused analysis driven by fundamental data. Note that our analysis may not factor in the latest price-sensitive company announcements or qualitative material. Simply Wall St has no position in any stocks mentioned.
