
 Yahoo Finance
 PRL Global's (ASX:PRG) Returns On Capital Are Heading Higher
Did you know there are some financial metrics that can provide clues of a potential multi-bagger? In a perfect world, we'd like to see a company investing more capital into its business and ideally the returns earned from that capital are also increasing. Ultimately, this demonstrates that it's a business that is reinvesting profits at increasing rates of return. So on that note, PRL Global (ASX:PRG) looks quite promising in regards to its trends of return on capital.
What Is Return On Capital Employed (ROCE)?
Just to clarify if you're unsure, ROCE is a metric for evaluating how much pre-tax income (in percentage terms) a company earns on the capital invested in its business. Analysts use this formula to calculate it for PRL Global:
Return on Capital Employed = Earnings Before Interest and Tax (EBIT) ÷ (Total Assets - Current Liabilities)
0.12 = AU$33m ÷ (AU$493m - AU$205m) (Based on the trailing twelve months to December 2023).
So, PRL Global has an ROCE of 12%. That's a relatively normal return on capital, and it's around the 11% generated by the Metals and Mining industry.
See our latest analysis for PRL Global
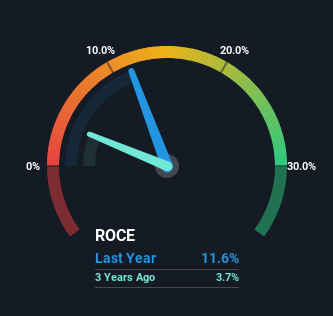
Historical performance is a great place to start when researching a stock so above you can see the gauge for PRL Global's ROCE against it's prior returns. If you're interested in investigating PRL Global's past further, check out this free graph covering PRL Global's past earnings, revenue and cash flow.
So How Is PRL Global's ROCE Trending?
PRL Global is displaying some positive trends. The data shows that returns on capital have increased substantially over the last five years to 12%. The company is effectively making more money per dollar of capital used, and it's worth noting that the amount of capital has increased too, by 25%. So we're very much inspired by what we're seeing at PRL Global thanks to its ability to profitably reinvest capital.
On a side note, we noticed that the improvement in ROCE appears to be partly fueled by an increase in current liabilities. Effectively this means that suppliers or short-term creditors are now funding 42% of the business, which is more than it was five years ago. And with current liabilities at those levels, that's pretty high.
In Conclusion...
All in all, it's terrific to see that PRL Global is reaping the rewards from prior investments and is growing its capital base. Since the total return from the stock has been almost flat over the last five years, there might be an opportunity here if the valuation looks good. So researching this company further and determining whether or not these trends will continue seems justified.
Like most companies, PRL Global does come with some risks, and we've found 3 warning signs that you should be aware of.
While PRL Global may not currently earn the highest returns, we've compiled a list of companies that currently earn more than 25% return on equity. Check out this free list here.
Have feedback on this article? Concerned about the content? Get in touch with us directly. Alternatively, email editorial-team (at) simplywallst.com.
This article by Simply Wall St is general in nature. We provide commentary based on historical data and analyst forecasts only using an unbiased methodology and our articles are not intended to be financial advice. It does not constitute a recommendation to buy or sell any stock, and does not take account of your objectives, or your financial situation. We aim to bring you long-term focused analysis driven by fundamental data. Note that our analysis may not factor in the latest price-sensitive company announcements or qualitative material. Simply Wall St has no position in any stocks mentioned.
Have feedback on this article? Concerned about the content? Get in touch with us directly. Alternatively, email editorial-team@simplywallst.com
