
 Yahoo Finance
 Provident Financial (LON:PFG) shareholders have endured a 83% loss from investing in the stock five years ago
It is doubtless a positive to see that the Provident Financial plc (LON:PFG) share price has gained some 33% in the last three months. But spare a thought for the long term holders, who have held the stock as it bled value over the last five years. In fact, the share price has tumbled down a mountain to land 89% lower after that period. It's true that the recent bounce could signal the company is turning over a new leaf, but we are not so sure. The real question is whether the business can leave its past behind and improve itself over the years ahead. We really feel for shareholders in this scenario. It's a good reminder of the importance of diversification, and it's worth keeping in mind there's more to life than money, anyway.
Since shareholders are down over the longer term, lets look at the underlying fundamentals over the that time and see if they've been consistent with returns.
Check out our latest analysis for Provident Financial
Provident Financial isn't currently profitable, so most analysts would look to revenue growth to get an idea of how fast the underlying business is growing. When a company doesn't make profits, we'd generally expect to see good revenue growth. As you can imagine, fast revenue growth, when maintained, often leads to fast profit growth.
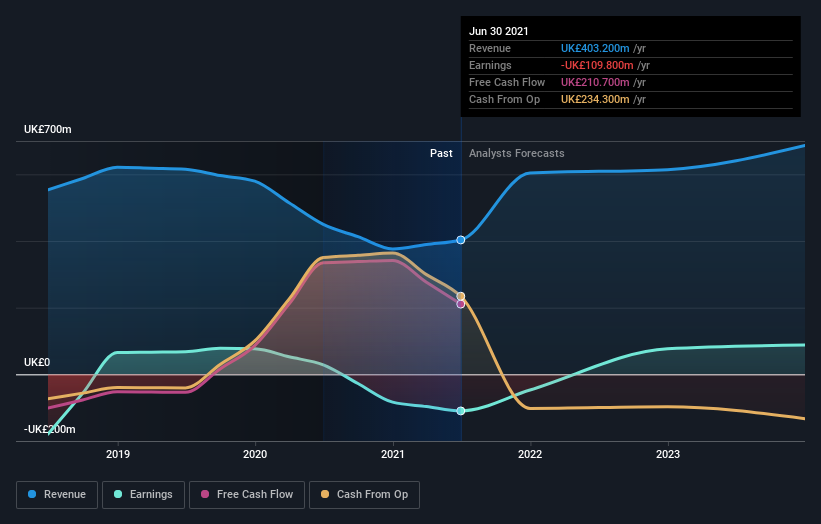
Over half a decade Provident Financial reduced its trailing twelve month revenue by 16% for each year. That puts it in an unattractive cohort, to put it mildly. So it's not that strange that the share price dropped 14% per year in that period. We don't think this is a particularly promising picture. Ironically, that behavior could create an opportunity for the contrarian investor - but only if there are good reasons to predict a brighter future.
You can see how earnings and revenue have changed over time in the image below (click on the chart to see the exact values).
This free interactive report on Provident Financial's balance sheet strength is a great place to start, if you want to investigate the stock further.
What about the Total Shareholder Return (TSR)?
Investors should note that there's a difference between Provident Financial's total shareholder return (TSR) and its share price change, which we've covered above. Arguably the TSR is a more complete return calculation because it accounts for the value of dividends (as if they were reinvested), along with the hypothetical value of any discounted capital that have been offered to shareholders. Provident Financial's TSR of was a loss of 83% for the 5 years. That wasn't as bad as its share price return, because it has paid dividends.
A Different Perspective
We're pleased to report that Provident Financial shareholders have received a total shareholder return of 82% over one year. That certainly beats the loss of about 13% per year over the last half decade. The long term loss makes us cautious, but the short term TSR gain certainly hints at a brighter future. It's always interesting to track share price performance over the longer term. But to understand Provident Financial better, we need to consider many other factors. To that end, you should learn about the 2 warning signs we've spotted with Provident Financial (including 1 which can't be ignored) .
Of course, you might find a fantastic investment by looking elsewhere. So take a peek at this free list of companies we expect will grow earnings.
Please note, the market returns quoted in this article reflect the market weighted average returns of stocks that currently trade on GB exchanges.
This article by Simply Wall St is general in nature. We provide commentary based on historical data and analyst forecasts only using an unbiased methodology and our articles are not intended to be financial advice. It does not constitute a recommendation to buy or sell any stock, and does not take account of your objectives, or your financial situation. We aim to bring you long-term focused analysis driven by fundamental data. Note that our analysis may not factor in the latest price-sensitive company announcements or qualitative material. Simply Wall St has no position in any stocks mentioned.
Have feedback on this article? Concerned about the content? Get in touch with us directly. Alternatively, email editorial-team (at) simplywallst.com.
