
 Yahoo Finance
 Should Prudential (LON:PRU) Be Disappointed With Their 21% Profit?
It's always best to build a diverse portfolio of shares, since any stock business could lag the broader market. But the goal is to pick stocks that do better than average. One such company is Prudential plc (LON:PRU), which saw its share price increase 21% in the last year, slightly above the market return of around 19% (not including dividends). In contrast, the longer term returns are negative, since the share price is 19% lower than it was three years ago.
See our latest analysis for Prudential
There is no denying that markets are sometimes efficient, but prices do not always reflect underlying business performance. One imperfect but simple way to consider how the market perception of a company has shifted is to compare the change in the earnings per share (EPS) with the share price movement.
Prudential was able to grow EPS by 8.7% in the last twelve months. The share price gain of 21% certainly outpaced the EPS growth. This indicates that the market is now more optimistic about the stock.
You can see below how EPS has changed over time (discover the exact values by clicking on the image).
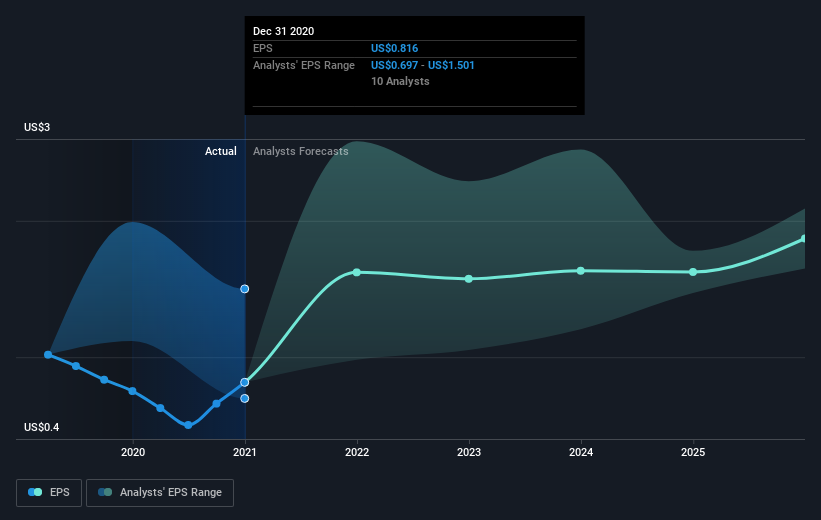
Dive deeper into Prudential's key metrics by checking this interactive graph of Prudential's earnings, revenue and cash flow.
A Different Perspective
Prudential provided a TSR of 22% over the last twelve months. But that return falls short of the market. The silver lining is that the gain was actually better than the average annual return of 9% per year over five year. This suggests the company might be improving over time. I find it very interesting to look at share price over the long term as a proxy for business performance. But to truly gain insight, we need to consider other information, too. For example, we've discovered 2 warning signs for Prudential (1 makes us a bit uncomfortable!) that you should be aware of before investing here.
If you are like me, then you will not want to miss this free list of growing companies that insiders are buying.
Please note, the market returns quoted in this article reflect the market weighted average returns of stocks that currently trade on GB exchanges.
This article by Simply Wall St is general in nature. It does not constitute a recommendation to buy or sell any stock, and does not take account of your objectives, or your financial situation. We aim to bring you long-term focused analysis driven by fundamental data. Note that our analysis may not factor in the latest price-sensitive company announcements or qualitative material. Simply Wall St has no position in any stocks mentioned.
Have feedback on this article? Concerned about the content? Get in touch with us directly. Alternatively, email editorial-team (at) simplywallst.com.
